
This is a multi part Elasticsearch Tutorial where we will cover all the related topics on ELK Stack using Elasticsearch 7.5
- Install and Configure ElasticSearh Cluster 7.5 with 3 Nodes
- Enable HTTPS and Configure SSS/TLS to secure Elasticsearch Cluster
- Install and Configure Kibana 7.5 with SSL/TLS for Elasticsearch Cluster
- Configure Metricbeat 7.5 to monitor Elasticsearch Cluster Setup over HTTPS
- Install and Configure Logstash 7.5 with Elasticsearch
Overview on Logstash
Logstash helps centralize event data such as logs, metrics, or any other data in any format. It can perform a number of transformations before sending it to a stash of your choice. It is a key component of the Elastic Stack, used to centralize the collection and transformation processes in your data pipeline.
Logstash is a server-side component. Its role is to centralize the collection of data from a wide number of input sources in a scalable way, and transform and send the data to an output of your choice. Typically, the output is sent to Elasticsearch, but Logstash is capable of sending it to a wide variety of outputs.
In this article we will learn
- Install and Configure Logstash 7.5
- How to send data from logstash to elasticsearch
- How to check if logstash is sending data to elasticsearch
Logstash Architecture
The Logstash event processing pipeline has three stages, that is, Inputs, Filters, and Outputs. A Logstash pipeline has two required elements, that is, input and output, and one option element known as filters:
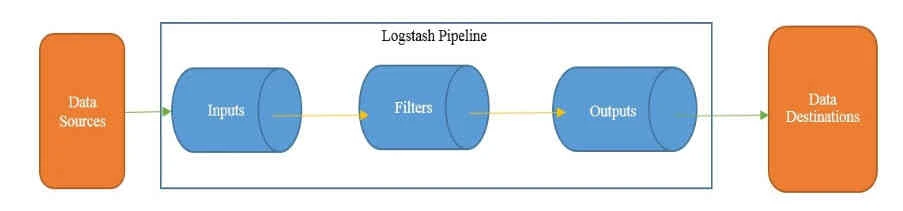
Credits: Lerning Logstash 7
Inputs create events, Filters modify the input events, and Outputs ship them to the destination. Inputs and outputs support codecs, which allow you to encode or decode the data as and when it enters or exits the pipeline, without having to use a separate filter.
Install Java
To configure Logstash we require Java 8 or Java 11. To check your Java version, run the following command
[root@centos-8 ~]# java -version
openjdk version "1.8.0_232"
OpenJDK Runtime Environment (build 1.8.0_232-b09)
OpenJDK 64-Bit Server VM (build 25.232-b09, mixed mode)
If java is not installed you can install it using official Oracle distibution or open source distribution
Install Logstash
We will use yum repository to install logstash but you can also choose other installation options from elasticsearch.
Download and install the public signing key:
Package installs and updates in this section use dnf command.
Trust a repo signing key with rpm --import; the rpm command lists key import and verification steps.
# rpm --import https://artifacts.elastic.co/GPG-KEY-elasticsearch
Add the following in your /etc/yum.repos.d/ directory in a file with a
.repo suffix, for example logstash.repo
[logstash-7.x]
name=Elastic repository for 7.x packages
baseurl=https://artifacts.elastic.co/packages/7.x/yum
gpgcheck=1
gpgkey=https://artifacts.elastic.co/GPG-KEY-elasticsearch
enabled=1
autorefresh=1
type=rpm-md
And your repository is ready for use. You can install it with:
# yum install logstash
Generate SSL certificates
We will use the certificates
we had created earlier for centos-8 on our ELK stack. Create a
directory certs under /etc/logstash/and copy all the certificates
we created in our earlier article
[root@centos-8 ~]# ls -l /etc/logstash/certs
total 16
-rw-r--r-- 1 root root 1200 Dec 30 19:51 ca.crt
-rw-r--r-- 1 root root 1200 Dec 31 13:08 centos-8.crt
-rw-r--r-- 1 root root 1679 Dec 30 20:00 centos-8.key
If you plan to use filebeat for your ELK stack then you must convert PEM certificate to PKCS#8 format
[root@centos-8 ~]# openssl pkcs8 -in centos-8.key -topk8 -nocrypt -out centos-8.pkcs8.key
Run Logstash
Logstash requires configuration to be specified while running it.
Configuration can be specified directly as an argument using the -e
option by specifying the configuration file (the .conf file) using the
-f option/flag. Before we configure logstash to connect with
elasticsearch cluster, first, let’s test your Logstash installation by
running the most basic Logstash pipeline.
A Logstash pipeline has two required elements, input and output, and one optional element, filter. The input plugins consume data from a source, the filter plugins modify the data as you specify, and the output plugins write the data to a destination.
The logstash binary is available inside
[root@centos-8 ~]# ls -l /usr/share/logstash/bin/logstash
-rwxr-xr-x 1 logstash logstash 2354 Dec 17 06:22 /usr/share/logstash/bin/logstash
(Optional) Now by default this path is not available in the PATH variable so we must use the absolute path everytime we execute logstash, to avoid this we will update our PATH variable. Below command wil temporarily update the PATH variable, to make it reboot persistent you can update this in the location where PATH variable is defined in your system.
[root@centos-8 ~]# export PATH=$PATH:/usr/share/logstash/bin
Verify the new PATH
[root@centos-8 ~]# echo $PATH
/usr/local/sbin:/usr/local/bin:/usr/sbin:/usr/bin:/root/bin:/usr/share/logstash/bin
Now we can directly execute logstash. After starting Logstash, wait
until you see "Successfully started Logstash API endpoint" and then
enter hello world at the command prompt:
[root@centos-8 ~]# logstash -e 'input { stdin { } } output { stdout {} }'
<Output trimmed>
The stdin plugin is now waiting for input:
[INFO ] 2019-12-31 18:48:30.830 [Api Webserver] agent - Successfully started Logstash API endpoint {:port=>9600}
Hello World
/usr/share/logstash/vendor/bundle/jruby/2.5.0/gems/awesome_print-1.7.0/lib/awesome_print/formatters/base_formatter.rb:31: warning: constant ::Fixnum is deprecated
{
    "@timestamp" => 2019-12-31T13:18:40.701Z,
          "host" => "centos-8",
       "message" => "Hello World",
      "@version" => "1"
}
The -e flag enables you to specify a configuration directly from the
command line. Specifying configurations at the command line lets you
quickly test configurations without having to edit a file between
iterations
Exit Logstash by issuing a CTRL-D command in the shell where Logstash
is running.
Basic Logstash pipeline
The Logstash pipeline is stored in a configuration file that ends with a .conf extension. The three sections of the configuration file are as follows:
input
{
}
filter
{
}
output
{
}
Each of these sections contains one or more plugin configurations. A
plugin can be configured by providing the name of the plugin and then
its settings as a key-value pair. The value is assigned to a key using
the => operator.
Below is a sample configuration file
- You may notice that this file contains two required elements, input and output, and that the input section has a plugin named stdin which accepts default parameters.
- The output section has a
stdoutplugin which accepts therubydebugcodec. - stdin is used for reading input from the standard input, and the
stdoutplugin is used for writing the event information to standard outputs. - The
rubydebugcodec will output your Logstash event data using the Ruby Awesome Print library. - It also contains a filter section that has a mutate plugin, which replaces text 'deepak' with 'rahul'.
[root@centos-8 ~]# cat console.conf
input {
   stdin{}
}

filter {
   ruby {
     code => 'event.set("message", event.get("message").sub("deepak", "rahul"))'
   }
}

output {
   stdout{codec => rubydebug}
}
We will execute logstash using -f and the configuration filename with
path.
[root@centos-8 logstash_files]# logstash -f console.conf
<Output trimmed>
[INFO ] 2019-12-30 20:51:28.279 [Agent thread] agent - Pipelines running {:count=>1, :running_pipelines=>[:main], :non_running_pipelines=>[]}
The stdin plugin is now waiting for input:
[INFO ] 2019-12-30 20:51:29.972 [Api Webserver] agent - Successfully started Logstash API endpoint {:port=>9601}
/usr/share/logstash/vendor/bundle/jruby/2.5.0/gems/awesome_print-1.7.0/lib/awesome_print/formatters/base_formatter.rb:31: warning: constant ::Fixnum is deprecated { "@version" => "1",
Hello World  <-- This is our first input
          "host" => "centos-8.example.com",
    "@timestamp" => 2019-12-30T15:22:03.820Z,
       "message" => "Hello World"
}
My name is deepak  <-- Next input

{
      "@version" => "1",
          "host" => "centos-8.example.com",
    "@timestamp" => 2019-12-30T15:22:09.715Z,
       "message" => "My name is rahul"  <-- The output was successfully processed and deepak was replaced by rahul
}
Configure logstash.yml to enable xpack monitoring
To configure logstash we must modify logstash.yml available inside
/etc/logstash. To control how monitoring data is collected from
Logstash and sent to elasticsearch, you configure xpack.monitoring
settings in logstash.yml.
node.name: centos-8
path.data: /var/lib/logstash
path.config: /etc/logstash/conf.d/*.conf
path.logs: /var/log/logstash
xpack.monitoring.enabled: true
xpack.monitoring.elasticsearch.username: 'logstash_system'
xpack.monitoring.elasticsearch.password: 'Passw0rd'
xpack.monitoring.elasticsearch.hosts: [ "https://192.168.0.11:9200", "https://192.168.0.12:9200", "https://192.168.0.13:9200" ]
xpack.monitoring.elasticsearch.ssl.certificate_authority: '/etc/logstash/certs/ca.crt'
Here we have used logstash_system built-in user and it's password to
connect to elasticsearch cluster
Connect logstash with Elasticsearch
This plugin is used fortransferringevents from Logstash to Elasticsearch. This plugin is the recommended approach for pushing events/log data from Logstash to Elasticsearch. Once the data is in Elasticsearch, it can be easily visualized using Kibana. This plugin requires no mandatory parameters and it automatically tries to connect to Elasticsearch
Since we are using /etc/logstash/conf.d/ as path.config to store the
configuration file, I will create my configuration file inside this
location which we will use to connect logstash to elasticsearch
[root@centos-8 ~]# cat /etc/logstash/conf.d/connect_slasticsearch.conf
input {
  beats {
    port => 5044
    ssl => true
    ssl_key => '/etc/logstash/certs/centos-8.key'
    ssl_certificate => '/etc/logstash/certs/ca.crt'
  }
  file {
         path => "/var/log/messages"
  }
}
output {
  elasticsearch {
    hosts => ["https://192.168.0.11:9200","https://192.168.0.12:9200","https://192.168.0.13:9200"]
    cacert => '/etc/logstash/certs/ca.crt'
    user => 'logstash_system'
    password => 'redhat'
  }
}
Since we are using SSL encryption to configure logstash and elasticsearch we will use respective values in the configuration file.
Start logstash service
We are all done with the steps to configure logstash and connect to our elasticsearch cluster. Start the logstash service and enable it to start automatically on every reboot
Control the running service with systemctl start, stop, or restart; see the systemctl command for try-restart and dependency behavior.
[root@centos-8 ~]# systemctl start logstash
[root@centos-8 ~]# systemctl enable logstash
You can monitor the logs of logstash service using
journalctl-u logstash -f or check the logs available inside
/var/log/logstash
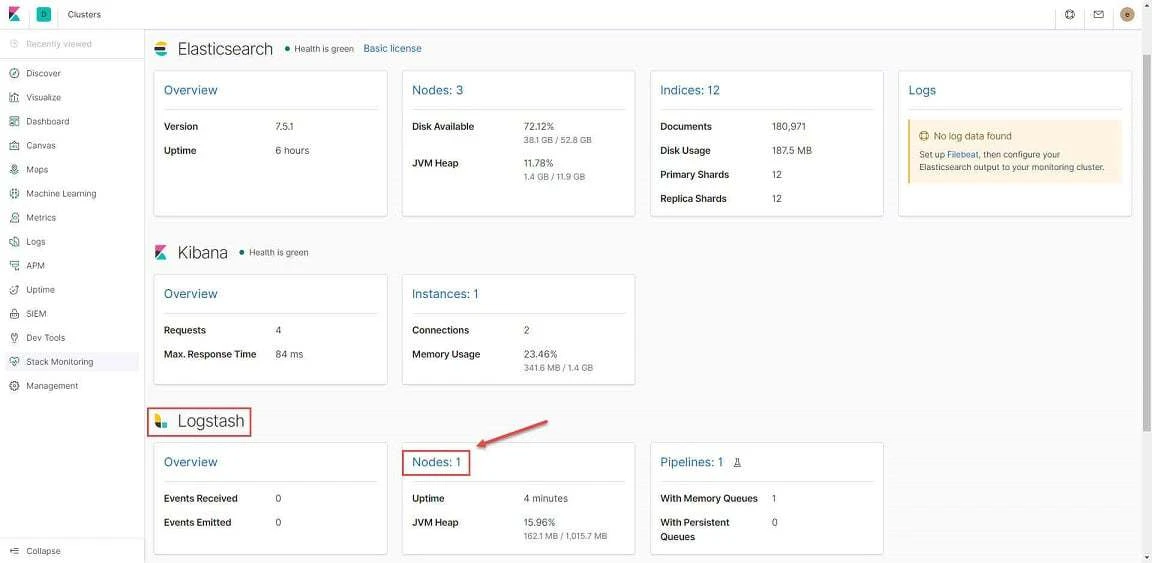
Now once you configure logstash, check Kibana's Stack Monitoring
section to make sure Logstash node is added.
Send data from logstash to elasticsearch
Here we will create a logstash pipeline and view the data on pipeline
using index. In this configuration file I will take input from the
content of /tmp/dummy.txt and the same will be visible on KIbana
dashboard.
To make this work we need two
terminal wherein on first terminal we will execute logstash and
on the other terminal we will append data into /tmp/dummy.txt file. As
soon as we input data into dummy.txt, the data will be visible on
logstash and can also be viewed on Kibana
[root@centos-8 logstash_files]# logstash -f console.conf
<Output trimmed>
[INFO ] 2019-12-30 23:48:08.587 [[main]-pipeline-manager] javapipeline - Pipeline started {"pipeline.id"=>"main"}
[INFO ] 2019-12-30 23:48:09.204 [Agent thread] agent - Pipelines running {:count=>1, :running_pipelines=>[:main], :non_running_pipelines=>[]}
[INFO ] 2019-12-30 23:48:09.223 [[main]<file] observingtail - START, creating Discoverer, Watch with file and sincedb collections [INFO ] 2019-12-30 23:48:11.735 [Api Webserver] agent - Successfully started Logstash API endpoint {:port=>9601}
{
      "@version" => "1",
       "message" => "Hello World",
          "path" => "/tmp/dummy.txt",
          "host" => "centos-8.example.com",
    "@timestamp" => 2019-12-30T18:19:09.053Z
}
{
      "@version" => "1",
       "message" => "Test Message 1",
          "path" => "/tmp/dummy.txt",
          "host" => "centos-8.example.com",
    "@timestamp" => 2019-12-30T18:19:29.955Z
}
{
      "@version" => "1",
       "message" => "Test Message 2",
          "path" => "/tmp/dummy.txt",
          "host" => "centos-8.example.com",
    "@timestamp" => 2019-12-30T18:19:35.024Z
}
^C[WARN ] 2019-12-30 23:49:39.441 [SIGINT handler] runner - SIGINT received. Shutting down.
[INFO ] 2019-12-30 23:49:39.792 [Converge PipelineAction::Stop
[INFO ] 2019-12-30 23:49:39.792 [Converge PipelineAction::Stop<main>] observingtail - QUIT - closing all files and shutting down.
[INFO ] 2019-12-30 23:49:40.506 [Converge PipelineAction::Stop<main>] javapipeline - Pipeline terminated {"pipeline.id"=>"main"}
[INFO ] 2019-12-30 23:49:40.741 [LogStash::Runner] runner - Logstash shut down.
In parallel I have another terminal window on which I am putting data
into /tmp/dummy.txt
[root@centos-8 ~]# echo "Hello World" >> /tmp/dummy.txt
[root@centos-8 ~]# echo "Test Message 1" >> /tmp/dummy.txt
[root@centos-8 ~]# echo "Test Message 2" >> /tmp/dummy.txt
So in the above highlighted section you can see that for every input in
/tmp/dummy.txt logstash generates an organised output based on our
configuration file.
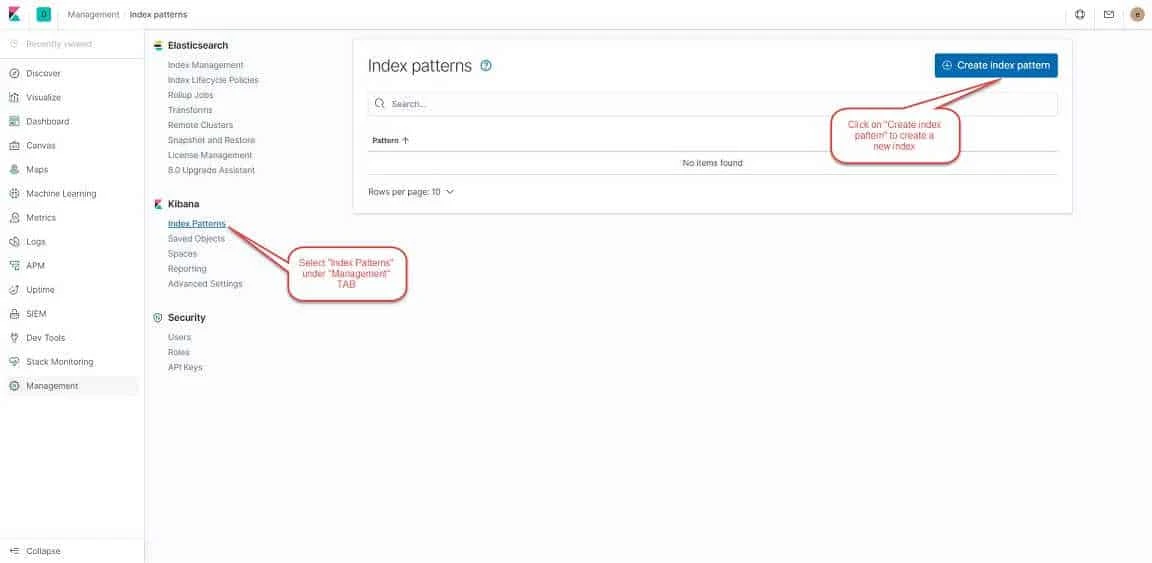
Visualise data on Kibana
Now to visualise the data on Kibana we must first create an index. To create an index login to Kibana Dashboard. Click on "Management" from the Left panel and click on **Index Patterns.**Follow the instructions from the below image:
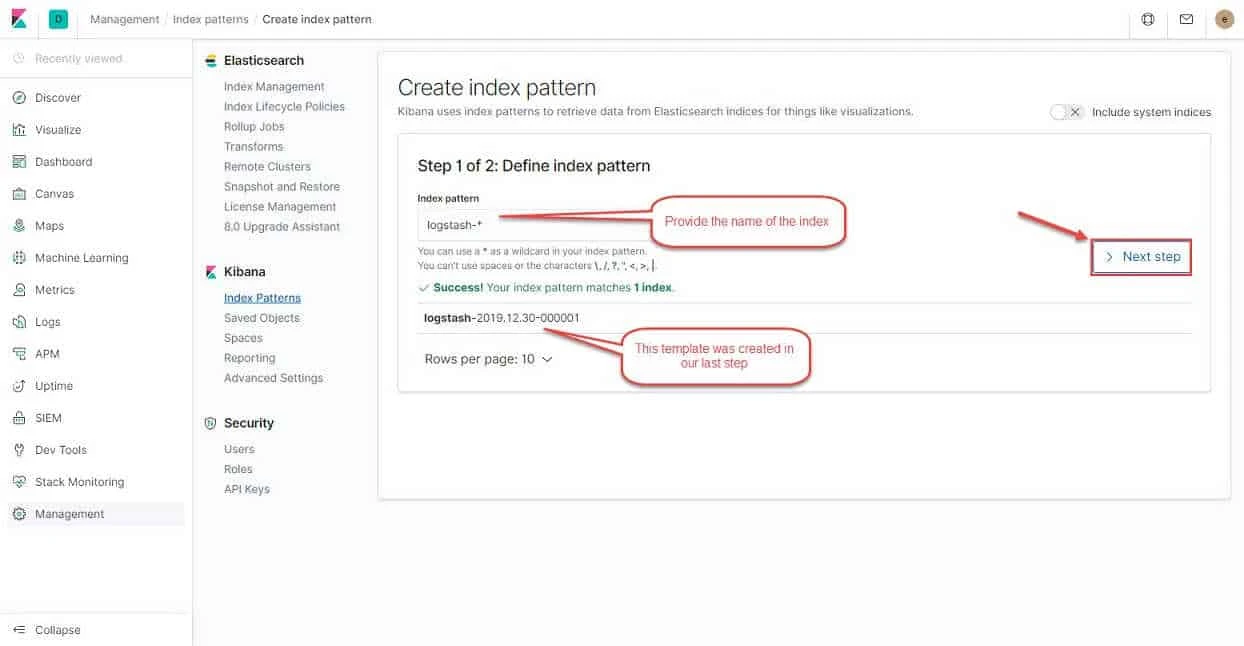
Click on "Create index pattern" to proceed to next step. provide the
index pattern as "logstash-*" as shown in the image and click on
"Next step"
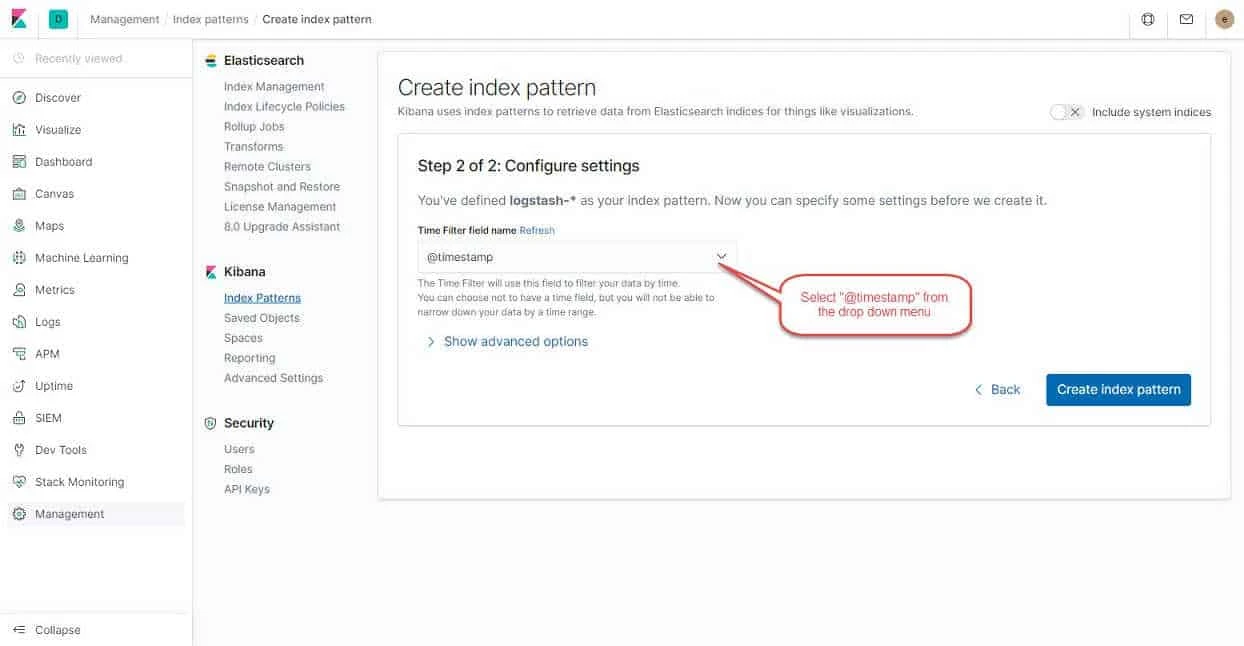
Next select the @timestamp field from the drop down menu and click on "Create index pattern"
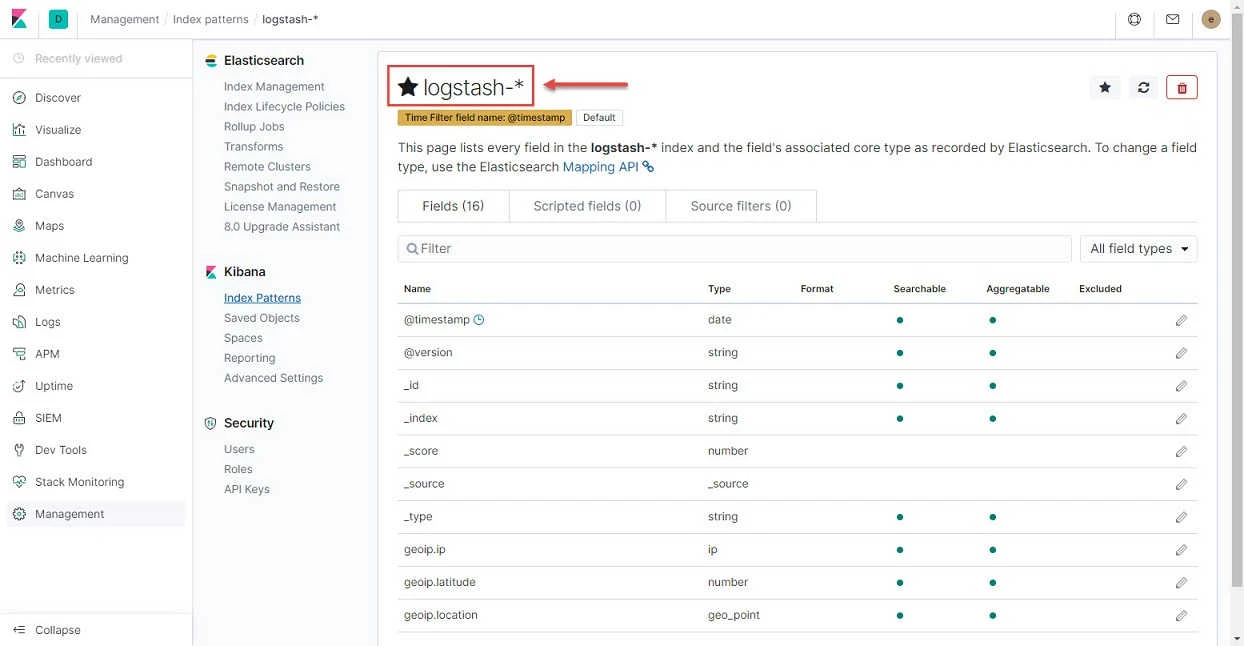
Below you can now see your index pattern is created
Next click on "Discover" from the left panel menu to visualise the logs we sent using our data pipeline to elasticsearch
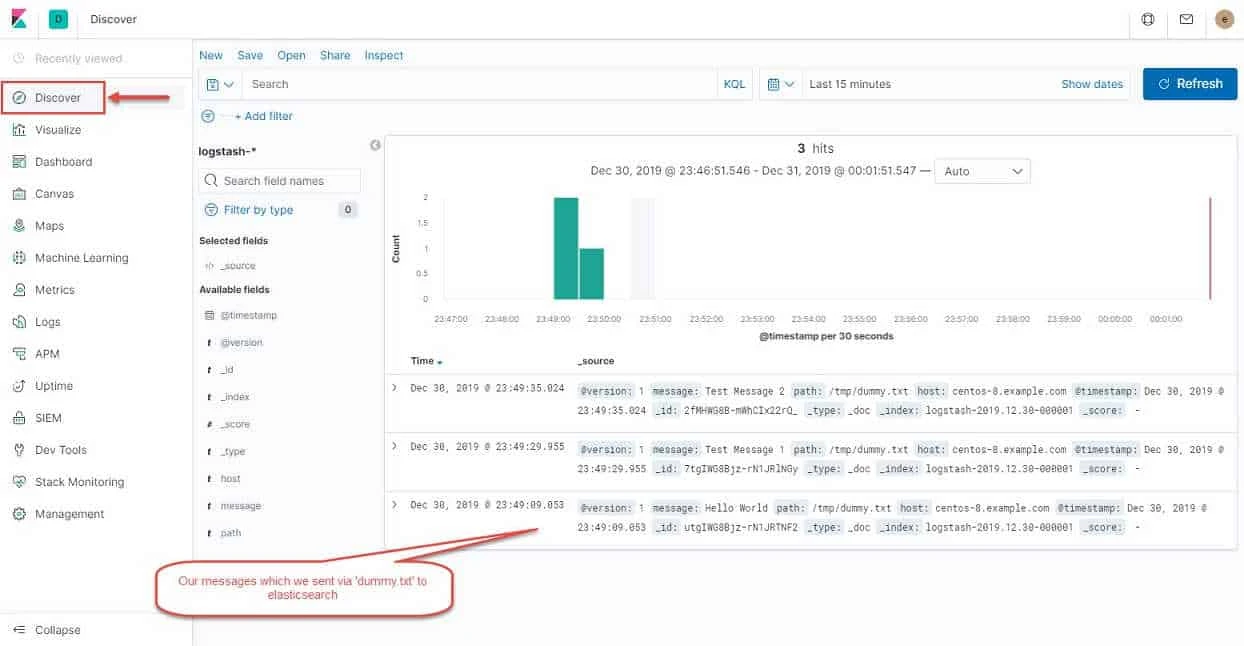
So all our logs from /tmp/dummy,txt is visible on Kibana dashboard.
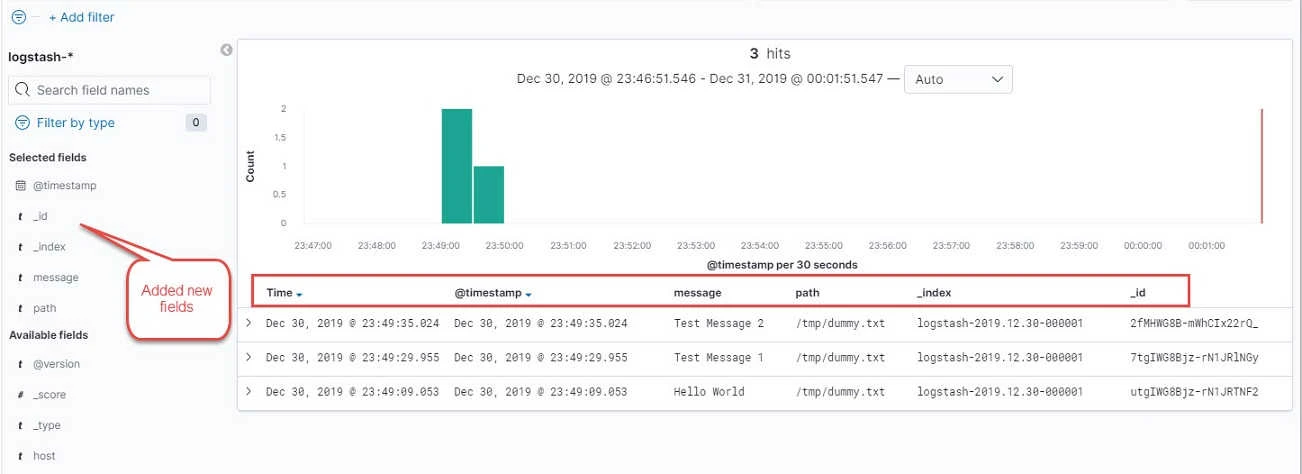
You can add more fields from the left panel section which you can see
under "Available fields"
So this was a basic configuration to visualise logs from elasticsearch cluster on Kibana dashboard using logstash.
Lastly I hope the steps from the article to configure logstash on RHEL/CentOS 7/8 Linux was helpful. So, let me know your suggestions and feedback using the comment section.