![Create Wireshark Configuration Profiles [Step-by-Step]](/create-wireshark-configuration-profiles/wireshark_profile.jpg)
Introduction to Wireshark Configuration Profiles
Wireshark comes with many great features. Professionals who are specialized in different areas use different features. For example, if you are a system admin you may use settings for troubleshooting and solving network related performance problems while a security analyst focuses more on doing network forensic or analyzing attack patterns.
Regarding these needs, Wireshark provides Profiles by which you can customize your settings like filtering buttons, coloring packets based on some condition, adding customized columns etc.
Create a configuration profile
After Wireshark installation, when you launch the application, you will have the “Default” profile. You can see it in the lower right corner of the application. The following figure shows up when you open Wireshark for the first time.
![Create Wireshark Configuration Profiles [Step-by-Step]](/create-wireshark-configuration-profiles/wireshark-119.webp)
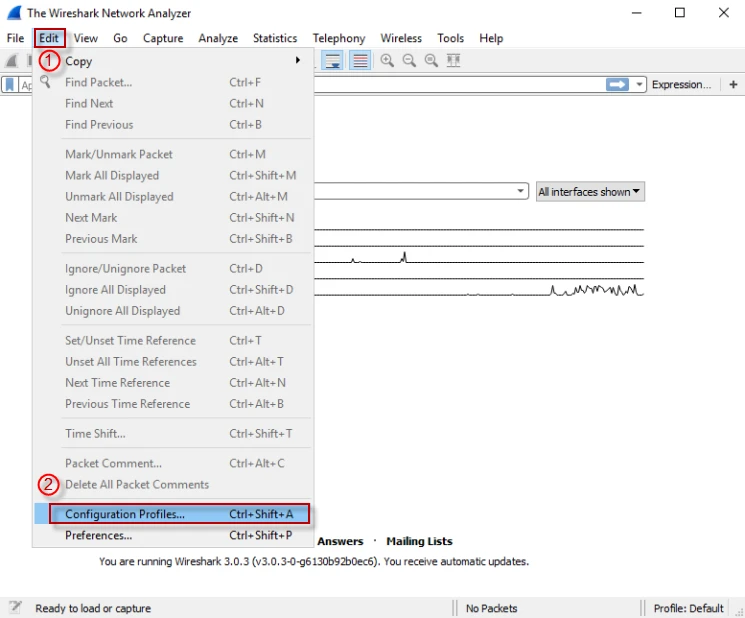
**Step 1:**Go to Edit menu and click on “Configuration Profiles” and a window pops out. (Edit → Configuration Profiles)
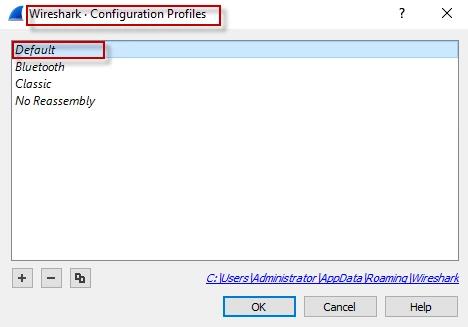
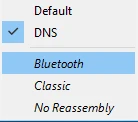
**Step 2:**In the list, you can see some built-in profiles like below.
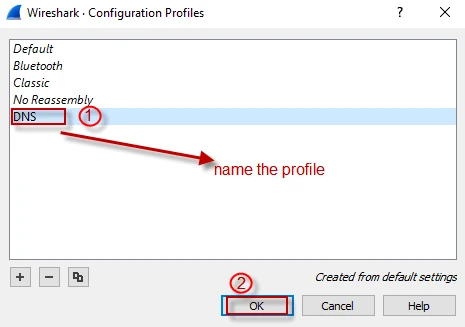
To create a new profile, click on the “+” button and give it a name, then click “OK” to save it.
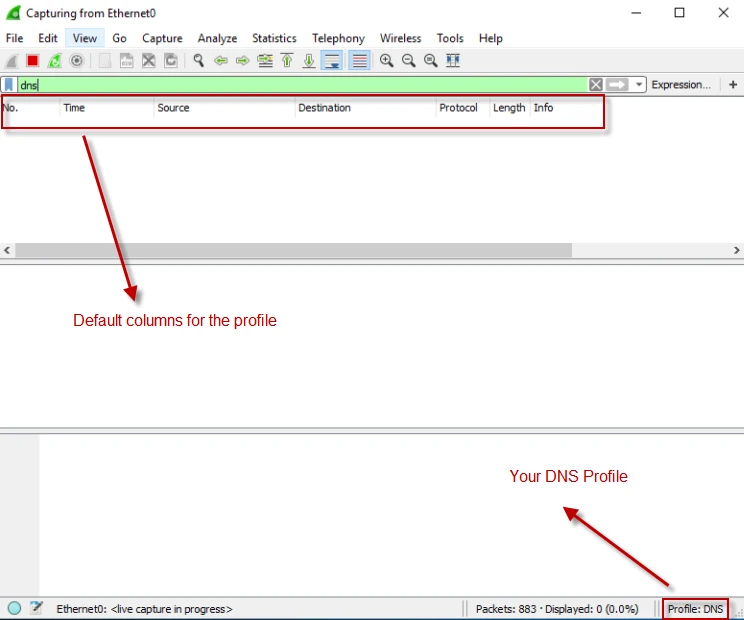
**Step 3:**When you go back to main window and look at the bottom corner of the window, you will see that your profile has been successfully created.
You can switch on between the profiles by click on the active profile in the status bar. When you click on the left button, a menu that lets you change your current profile appears.
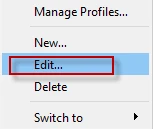
When you need to modify or add a new profile, just right click on the profile from lower left of the window, then Edit menu shows up.
Customize DNS configuration profile
We already created a DNS profile; however, it does not look different from the Default profile. Indeed, we did nothing at all except creating an empty DNS profile. when I troubleshoot issues related to DNS, I use my customized DNS profile for time saving. Especially, two fields - Response packet number and Response Time- are important for me, which are great indicators to see if there have been some latency issues. I will add both of the fields as column names.
Step-1: Create custom columns
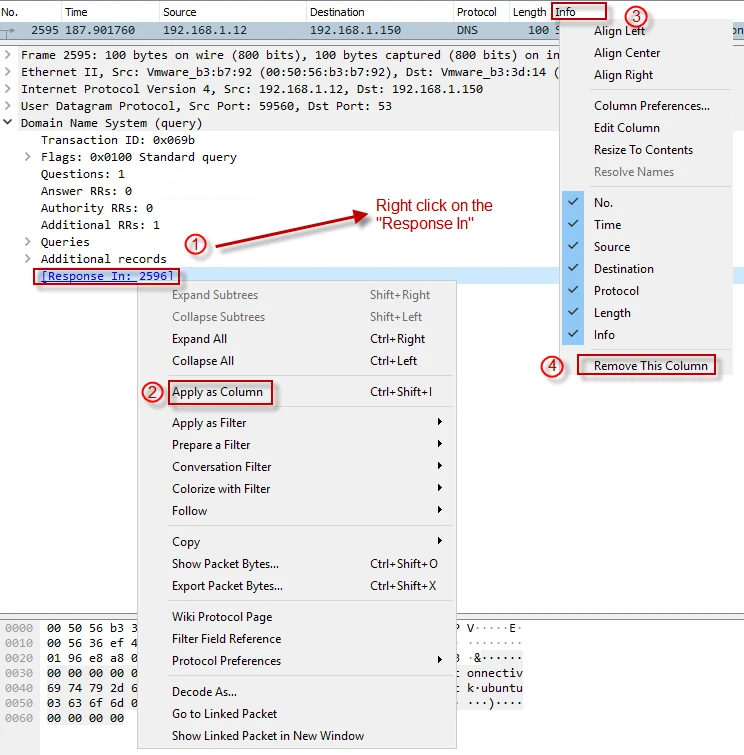
We will first create “Response In” column and it will point the packet that carries a response for the query.
1) Find a DNS request packet and go to DNS header.
2) Right click on the “Response In” and pick “Apply as Column”
3) We do not need packet “length” and “info” columns, right click on one of the columns, a menu appears. Click on “Remove This Colum”.
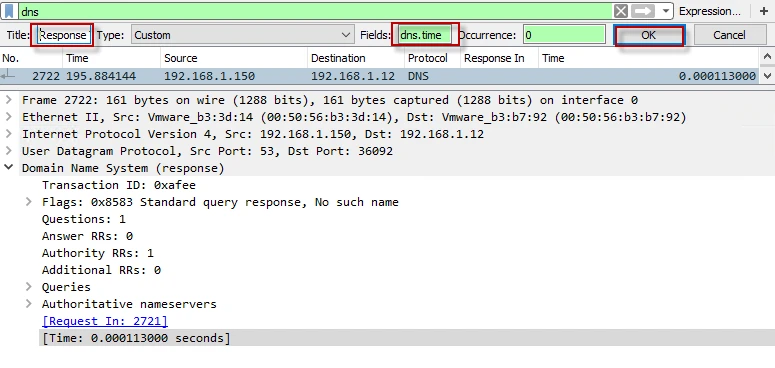
4) In this step, we will create a column out of “Time” field in a dns response packet. Find a DNS response packet and repeat the same steps for this field too. It will add “Time” column. We need to edit it by right clicking on the column.
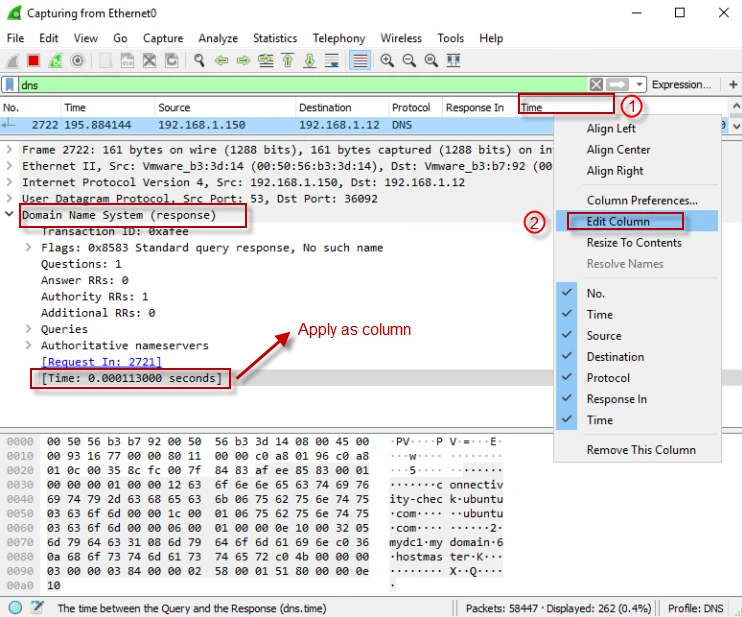
Once Edit menu appears, customize the column as you wish and click “OK” to save it.
In the end, you should see columns like below.

You can create many custom columns like that, considering your need.
Step-2: Create custom filter buttons
When there is a time critical issue, you do not want to lose time with creating some display filters to see what is going on. Instead you can use a pre-build filter buttons for that kind of cases to gain time. Lets create two buttons one of which will filter all response dns packets (dns server answers) while the other will show response time higher than a specific value (dns.time > 0.5 second)
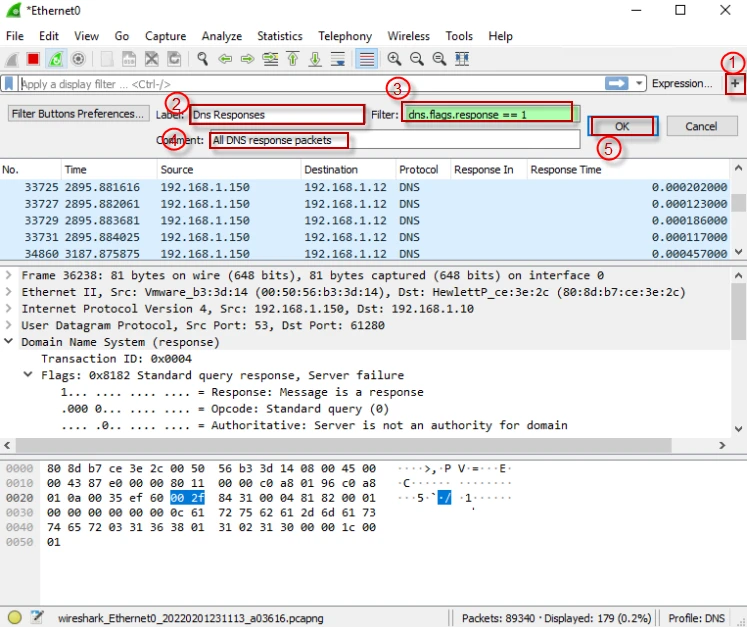
1) Go to top right corner of the window and press “+” to add a display filter button. Fill the areas like below and click “Ok” to save.
Label: Dns Responses
Filter: dns.flags.response == 1
Comment: All DNS response packets
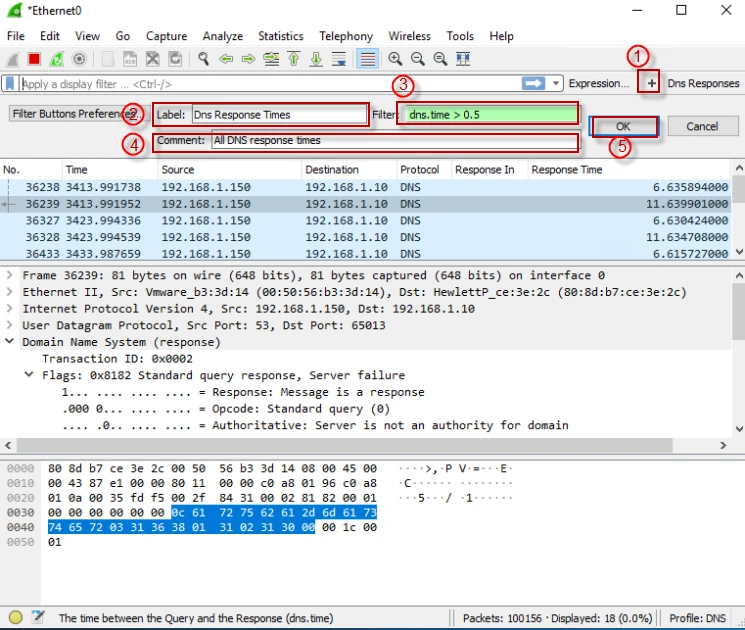
2) To create a filter button that shows packets having response time bigger than 0.5 ms, follow the same step above and fill the areas like below.
Label: Dns Response Times
Filter: dns.time > 0.5
Comment: All DNS response times
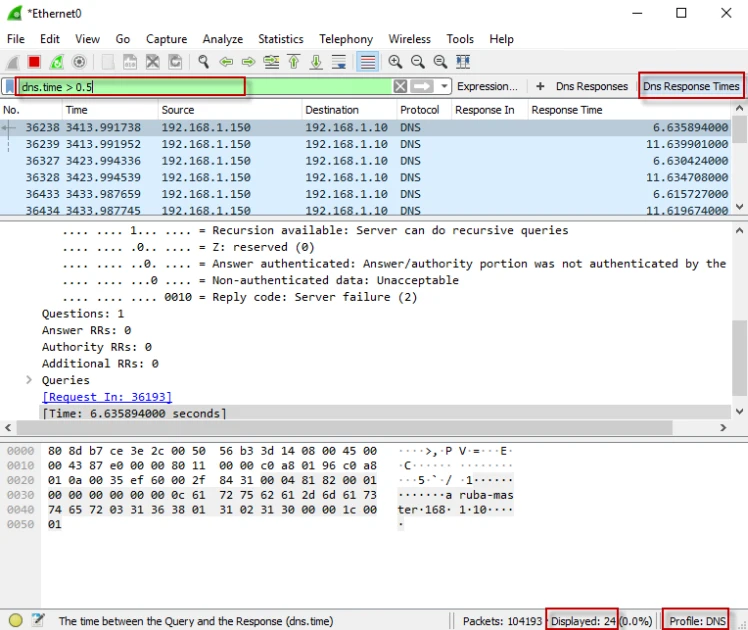
In the end, when clicking on the “Dns Response Times” button, it will show you the response packet that delayed more than 0.5 second. My result below shows that response time of 24 packets is higher than 0.5 second, which means there must be an issue with either my network or the dns server.
Step-3: Create packet colorization rule
Along with capture filters and display filters, Wireshark has also color filters, which make it easier for "interesting" traffic to be highlighted, making troubleshooting a bit simpler. I will create a color rule that colors the packets we are interested in.
1) Navigate to View menu and click “Coloring Rules...” (View → Coloring Rules)
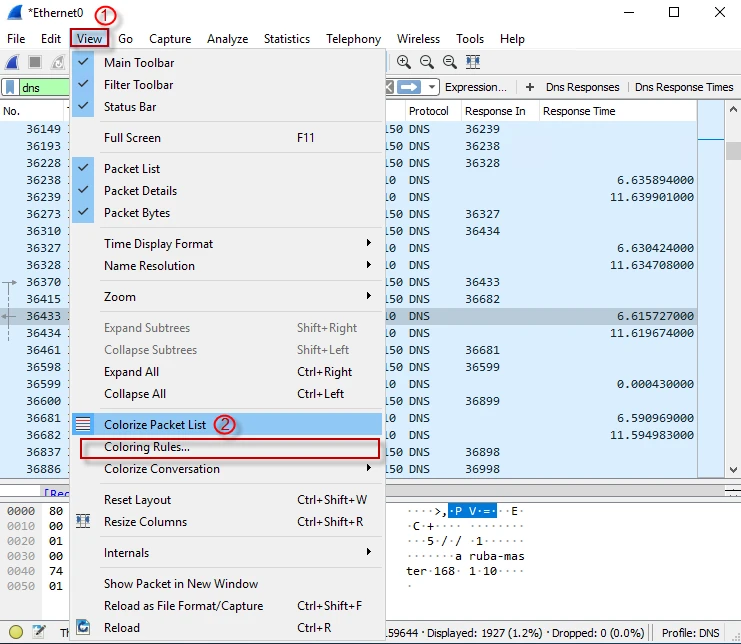
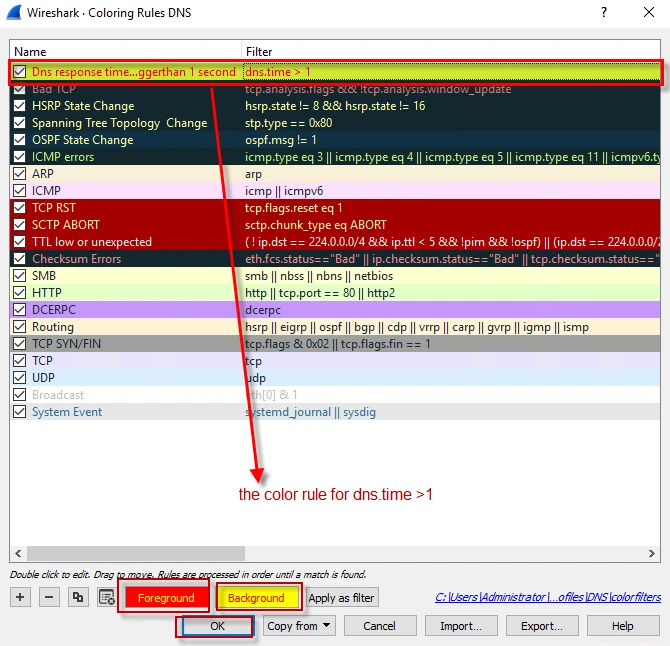
2) Click on “+” button to create a new coloring rule. Fill the areas like below.
Name: Dns response time bigger than 1 second
Filter: dns.time > 1
3) After enabling the rule with tick (✓) symbol, select a color for both “Foreground” and “Background” then click “Ok” to save it.
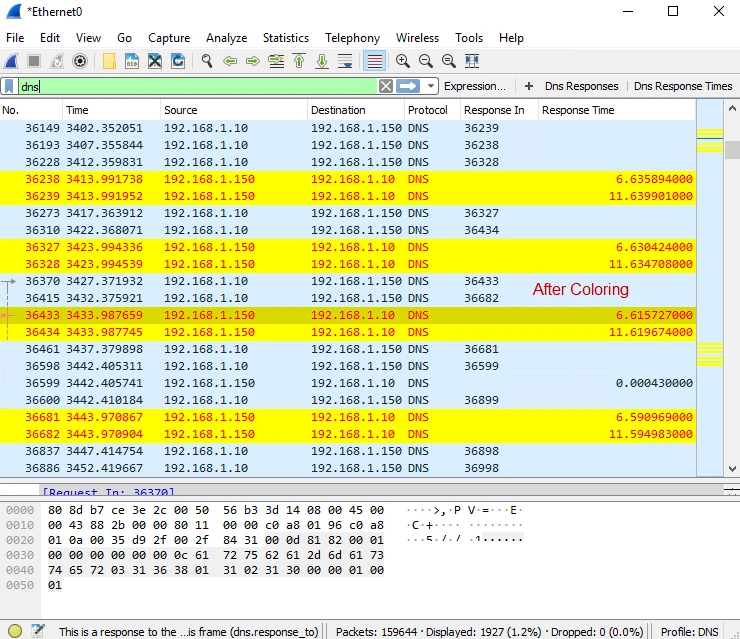
After applying the rule, it is almost impossible not to notice there has been a problem with dns resolution. Before and after coloring is following.
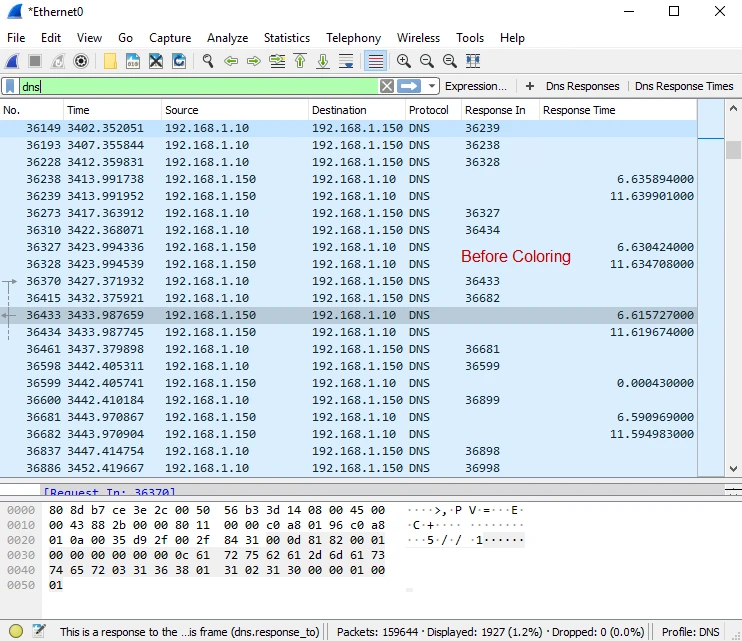
As you can see coloring rule creates more striking output, which lets you distinguish the packets easily. In the figure below, you can see there is a massive latency for name resolution in the “Response Time” column, which indicate that we need to take a look.
Display filter customization for TCP
When we troubleshoot a network issue, we may need to use multiple display filter. Some of them can include many conditions, which takes time to produce the same filter again and again. Wireshark lets you manage your display filter. You can save, delete or modify them as you wish. To save your filters in to your custom profile, follow the steps below.
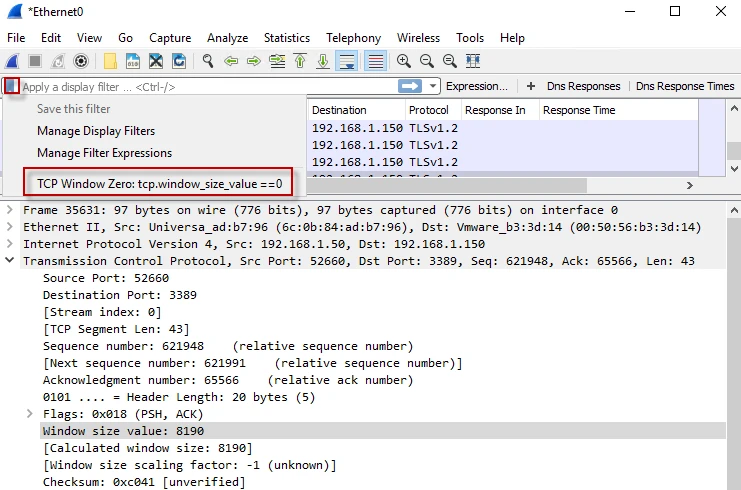
1) We will create a filter that shows only TCP segments that have window zero header.
2) Click on the little bookmark icon to the left of display filter bar and then “Manage Display Filter”.
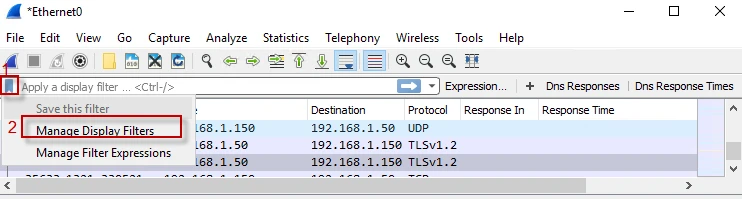
3) Display Filter menu appears. Click on the “+” button to create a new display filter.
4) Name it as: "TCP Window Zero" and type
“tcp.window_size_value ==0” as filter.
5) Click Ok button to save the display filter.
6) To use the filter, click on the little bookmark again, you will see your filter in the menu like below.
Import and export configuration profile
Wireshark lets you to export your profiles so that you can import them later in another computer or share them with some friends.
1) Navigate to Edit → Configuration Profiles.
2) Select the profile you would like to export.
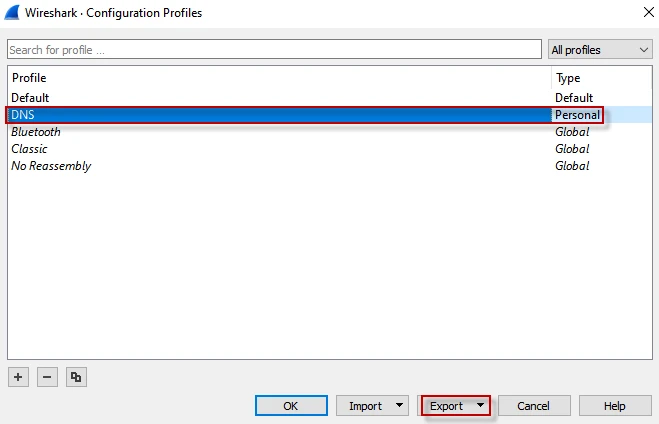
3) Then click “Export” button to save the profile in a zip file. Now you can copy your profile to anywhere you want
4) For importing a profile, navigate to the same window and just click the “Import” button to proceed.
Where is my configuration profile stored and how can I find them?
Configuration Profiles are stored in text files. To find them follow the steps below.
1) Go to “Help” menu and click on “About Wireshark” (Help à About Wireshark)
2) A window pops out like below. Click on the Folder tab.
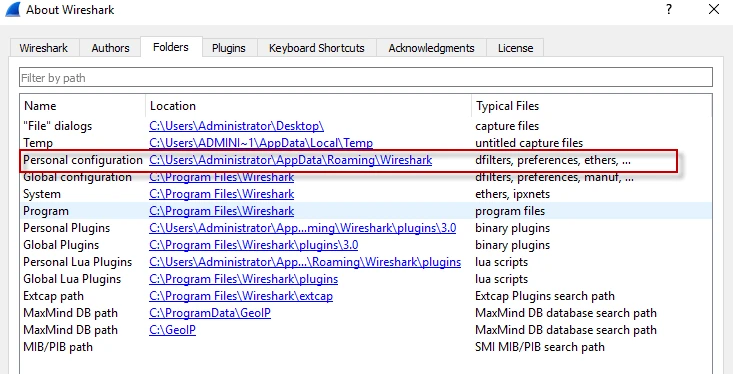
3) Next click on the “Personal configuration” in the list and it will open the directory contains your profile files.
4) Drill down to the directory to the profile you want. (when you have multiple profiles)
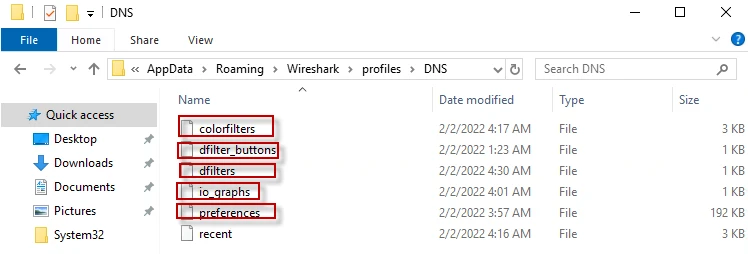
As you see in the figure above, I also customized I/O graph and other preferences as well.
Final thoughts
Wireshark profiles are ultimate time saver. They can be customized regarding applications, protocols, network performance or security parameters. New profiles can be imported or you can export your profiles for sharing with someone else or just only for backup purpose.