This is a multi part Elasticsearch Tutorial where we will cover all the related topics on ELK Stack using Elasticsearch 7.5
- Install and Configure ElasticSearh Cluster 7.5 with 3 Nodes
- Enable HTTPS and Configure SSS/TLS to secure Elasticsearch Cluster
- Install and Configure Kibana 7.5 with SSL/TLS for Elasticsearch Cluster
- Configure Metricbeat 7.5 to monitor Elasticsearch Cluster Setup over HTTPS
- Install and Configure Logstash 7.5 with Elasticsearch
Overview on Kibana
Kibana is the UI for the Elastic Stack and is primarily used for data analysis and visualization. Kibana also provides developer tools, which is very handy for running Elasticsearch queries. The Kibana monitoring features serve two separate purposes
- To visualize monitoring data from across the Elastic Stack. You can view health and performance data for Elasticsearch, Logstash, and Beats in real time, as well as analyze past performance. To monitor Kibana itself and route that data to the monitoring cluster.
- If you enable monitoring across the Elastic Stack, each Elasticsearch node, Logstash node, Kibana instance, and Beat is considered unique based on its persistent UUID, which is written to the path.data directory when the node or instance starts.
Install Kibana
Using the RPM package, we can install Kibana on openSUSE, CentOS, or Red Hat-based systems. We can download the RPM package from the Elastic website or from the apt repository. We are free to use the RPM package under the Elastic license.
If you have multiple nodes in your Elasticsearch cluster, the easiest
way to distribute Kibana requests across the nodes is to configure
Kibana on an Elasticsearch co-ordinating only node. To configure
elasticsearch as coordinating node use below values in
elasticsearch.yml. In this article we are using a separate node to
install and configure Kibana 7.x with SSL/TLS.
node.master: false
node.data: false
node.ingest: false
Currently at the time of writing this article Kibana 7.5.1 was the latest available version available at below link which we have used for installation purpose
[root@centos-8 ~]# rpm -Uvh https://artifacts.elastic.co/downloads/kibana/kibana-7.5.1-x86_64.rpm

[root@centos-8 ~]# rpm -q kibana
kibana-7.5.1-1.x86_64
If you attempt to start kibana service without enabling security then you will most likely get below error (depending upon the license type you are using)
Security must be explicitly enabled when using a [basic] license. Enable security by setting [xpack.security.enabled] to [true] in the elasticsearch.yml file and restart the node.
Transport SSL must be enabled if security is enabled on a [basic] license. Please set [xpack.security.transport.ssl.enabled] to [true] or disable security by setting [xpack.security.enabled] to [false]
I have covered this part to enable security in my last article
Monitor Elasticsearch Cluster
To monitor elasticsearch cluster and control how data is collected from
your Elasticsearch nodes, you configure xpack.monitoring.collection
settings in elasticsearch.yml of all the cluster nodes.
xpack.monitoring.collection.enabled: true
xpack.monitoring.elasticsearch.collection.enabled: false
Configure Kibana
Modify the following directives in /etc/kibana/kibana.yml file to
configure kibana and enable monitoring in Elastic Stack
- server.port: Default: 5601 Kibana is served by a back end server. This setting specifies the port to use.
- server.host: This setting specifies the host of the back end server. To allow remote users to connect, set the value to the IP address or DNS name of the Kibana server.
- server.name: A human-readable display name that identifies this Kibana instance.
- elasticsearch.hosts: The URLs of the Elasticsearch instances to use for all your queries. All nodes listed here must be on the same cluster.
- elasticsearch.username and elasticsearch.password: If your Elasticsearch is protected with basic authentication, these settings provide the username and password that the Kibana server uses to perform maintenance on the Kibana index at startup. Your Kibana users still need to authenticate with Elasticsearch, which is proxied through the Kibana server.
Modify /etc/kibana/kibana.yml file to configure Kibana and monitor
elasticsearch cluster. Below is my sample configuration file:
[root@centos-8 elasticsearch]# sed  '/^#/d' /etc/kibana/kibana.yml | sed '/^$/d'
server.port: 5601
server.host: "192.168.0.14"
server.name: "centos-8.example.com"
elasticsearch.username: "kibana"
elasticsearch.password: "Passw0rd"
(Optional) If you prefer not to put your user ID and password in the
kibana.yml file while you configure Kibana, store them in a keystore
instead. Run the following commands to create the Kibana keystore and
add the secure settings:
[root@centos-8 ~]# /usr/share/kibana/bin/kibana-keystore create --allow-root
Created Kibana keystore in /var/lib/kibana/kibana.keystore

[root@centos-8 ~]# /usr/share/kibana/bin/kibana-keystore add elasticsearch.username --allow-root
Enter value for elasticsearch.username: ******

[root@centos-8 ~]# /usr/share/kibana/bin/kibana-keystore add elasticsearch.password --allow-root
Enter value for elasticsearch.password: ******
When prompted, specify the kibana built-in user and its password for
these setting values. The settings are automatically applied when you
start Kibana.
For basic and production license it is important to enable security to configure Kibana dashboard.
Enable HTTPS Communication (Optional)
Certificates that will be used for PKI authentication must be signed by the same CA as the certificates that are used for encrypting http communications. Normally, these would be signed by an official CA within an organization. However, because we have already created CA and other certificates we will use the same to enable https communication for Kibana.
Since we are installing kibana on centos-8.example.com, we will use
the keys we created for centos-8. Create /etc/kibana/config/certs/
directory where we will store the keys required to enable https
[root@centos-8 ~]# ls -l /etc/kibana/certs/
total 12
-rw-r--r-- 1 root root 1200 Dec 27 18:52 ca.crt
-rw-r--r-- 1 root root 1200 Dec 27 18:52 centos-8.crt
-rw-r--r-- 1 root root 1679 Dec 27 18:52 centos-8.key
Set the server.ssl.enabled, server.ssl.key, and
server.ssl.certificate properties. Below is the content from my
kibana.yml.
server.ssl.enabled: true
server.ssl.certificate: /etc/kibana/certs/centos-8.crt
server.ssl.key: /etc/kibana/certs/centos-8.key
Configure Kibana to connect to Elasticsearch via HTTPS
To perform this step, you must
enable the Elasticsearch
security features or you must have a proxy that provides an
HTTPS endpoint for Elasticsearch. Specify the HTTPS protocol in the
elasticsearch.hosts setting in the Kibana configuration file,
kibana.yml:
elasticsearch.hosts: ["https://192.168.0.11:9200", "https://192.168.0.12:9200", "https://192.168.0.13:9200"]
If you are using your own CA to sign certificates for Elasticsearch, set
the elasticsearch.ssl.certificateAuthorities setting in kibana.yml
to specify the location of the PEM file.
elasticsearch.ssl.certificateAuthorities: [ "/etc/kibana/certs/ca.crt" ]
Setting the certificateAuthorities property lets you use the default
verificationMode option of full.
elasticsearch.ssl.verificationMode: 'full'
Here,
- server.ssl.enabled: Enables SSL for outgoing requests from the
Kibana server to the browser. When set to true,
server.ssl.certificateandserver.ssl.keyare required. - server.ssl.certificate and server.ssl.key: Paths to the PEM-format SSL certificate and SSL key files, respectively.
- elasticsearch.ssl.certificateAuthorities: Optional setting that enables you to specify a list of paths to the PEM file for the certificate authority for your Elasticsearch instance.
- elasticsearch.ssl.verificationMode: Controls the verification of certificates presented by Elasticsearch. Valid values are none, certificate, and full. full performs hostname verification, and certificate does not.
Configure Firewall
Kibana uses 5601 TCP port so you can enable the same in your firewall.
[root@centos-8 ~]# firewall-cmd --add-port=5601/tcp --permanent
success

[root@centos-8 ~]# firewall-cmd --reload
success
Start Kibana server
We are all done with the steps to configure Kibana over HTTPS, you can
start kibana service using systemctl. This command will start the
service and make the changes persistent across reboot.
[root@centos-8 ~]# systemctl enable kibana --now
Check if port 5601 port is in LISTEN state on Kibana server
[root@centos-8 ~]# netstat -ntlp | grep node
tcp        0      0 0.0.0.0:5601            0.0.0.0:*               LISTEN      4464/node
Check service status
[root@centos-8 ~]# systemctl status kibana
● kibana.service - Kibana
   Loaded: loaded (/etc/systemd/system/kibana.service; enabled; vendor preset: disabled)
   Active: active (running) since Tue 2019-12-24 23:03:15 IST; 27s ago
 Main PID: 12928 (node)
   CGroup: /system.slice/kibana.service
           └─12928 /usr/share/kibana/bin/../node/bin/node /usr/share/kibana/bin/../src/cli -c /etc/kibana/kibana.yml

Dec 24 23:03:18 centos-8.example.com kibana[12928]: {"type":"log","@timestamp":"2019-12-24T17:33:18Z","tags":["info","plugins","data"],...lugin"}
Dec 24 23:03:38 centos-8.example.com kibana[12928]: {"type":"log","@timestamp":"2019-12-24T17:33:38Z","tags":["info","plugins","licensi...ctive"}
Wait for few seconds and check
the latest logs from kibana to make sure there are no errors
reported and you are not getting Kibana server is not ready yet
[root@centos-8 ~]# journalctl -u kibana.service
Or to monitor live logs using journalctl
[root@centos-8 ~]# journalctl -u kibana.service -f
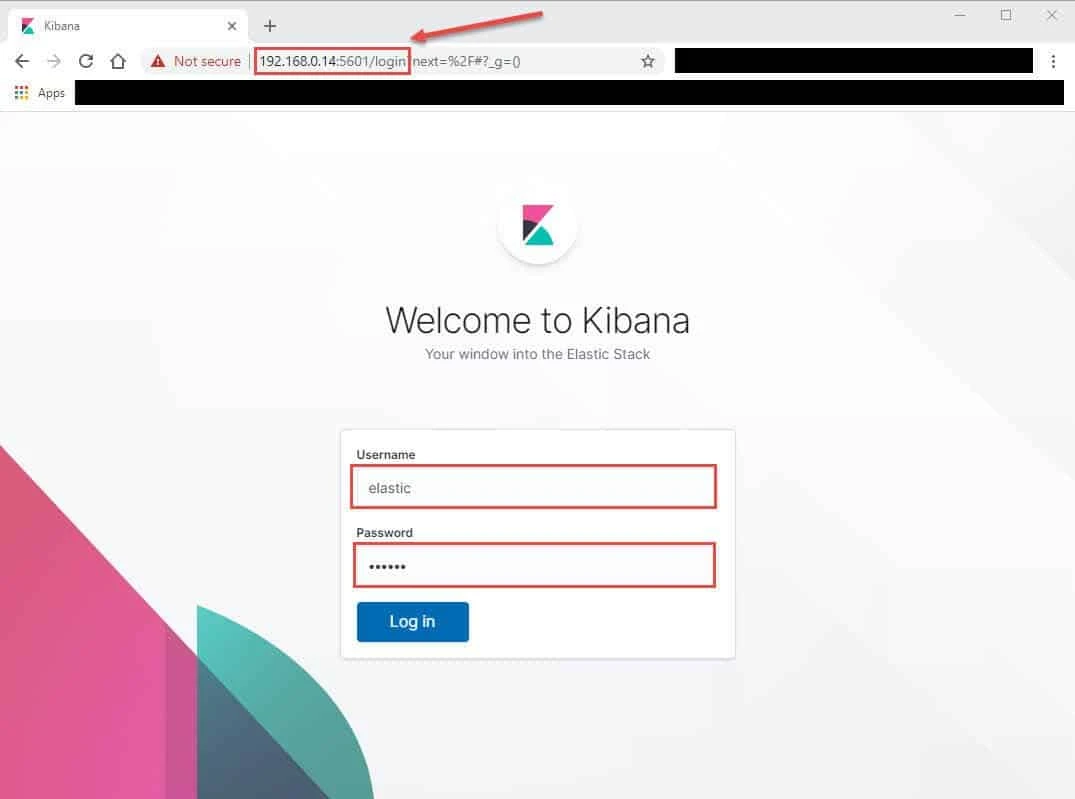
Login Kibana UI
Access https://192.168.0.14:5601/ from a browser. Log in using the
elastic user and the password that we created in this article
using elasticsearch-setup-passwords
Kibana server is not ready yet"
message for few seconds after starting kibana service. Wait for a couple
of minutes and refresh the browser. But if you continue to get
"Kibana server is not ready yet" message on the GUI then check
journalctl -u kibana.service for any error message. You can use
journalctl to view live logs from Kibana Server.
Troubleshooting Error Messages:
Below are some of the common error messages which can be seen with Kibana Server configuration
Error: ElasticsearchException: failed to initialize SSL KeyManager - not permitted to read keystore file
Caused by: java.security.AccessControlException: access denied ("java.io.FilePermission" "/etc/kibana/certs/ca.crt" "read")
ElasticsearchException: failed to initialize SSL KeyManager - not permitted to read keystore file [/etc/elasticsearch/config/certs/elastic-stack-ca.p12]
Solution:
The error itself here is pretty clear, check the file permission on the
certificate file and it should be readable for the respective user.
Error: Kibana server is not ready yet
Kibana server is not ready yet
Explanation:
There can be many possible reason for KIbana dasboard failing to load
with the error Kibana server is not ready yet. This would basically
mean that the Kibana Service is having some errors which must be
rectified before the dashboard is accessible. So you must check Kibana
service logs which will be available inside /var/log/messages.
**Solution:
**For Example on Kibana server is not ready yet, I was getting the
bellow error in /var/log/messages
Elasticsearch Unreachable: [https://logstash_system:[email protected]:9200/][Manticore::SocketException] No route to host (Host unreachable)"}
When my elasticsearch cluster was unreachable the Kibana dashboard
failed to load with error Kibana server is not ready yet. So once my
elasticsearch cluster was UP, the dashboard was UP and running.
Lastly I hope the steps from the article to install and configure Kibana over HTTPS in RHEL/CentOS 7/8 Linux was helpful. So, let me know your suggestions and feedback using the comment section.