This is a multi part Elasticsearch Tutorial where we will cover all the related topics on ELK Stack using Elasticsearch 7.5
- Install and Configure ElasticSearh Cluster 7.5 with 3 Nodes
- Enable HTTPS and Configure SSS/TLS to secure Elasticsearch Cluster
- Install and Configure Kibana 7.5 with SSL/TLS for Elasticsearch Cluster
- Configure Metricbeat 7.5 to monitor Elasticsearch Cluster Setup over HTTPS
- Install and Configure Logstash 7.5 with Elasticsearch
ELK Stack Components
The Elastic Stack, formerly called ELK, provides the different layers that are needed to implement a data-driven architecture.
It starts from the ingestion layer with Beats, Logstash , then to a distributed data store with Elasticsearch, and, finally, to the visualization layer with Kibana, as shown in the following diagram:
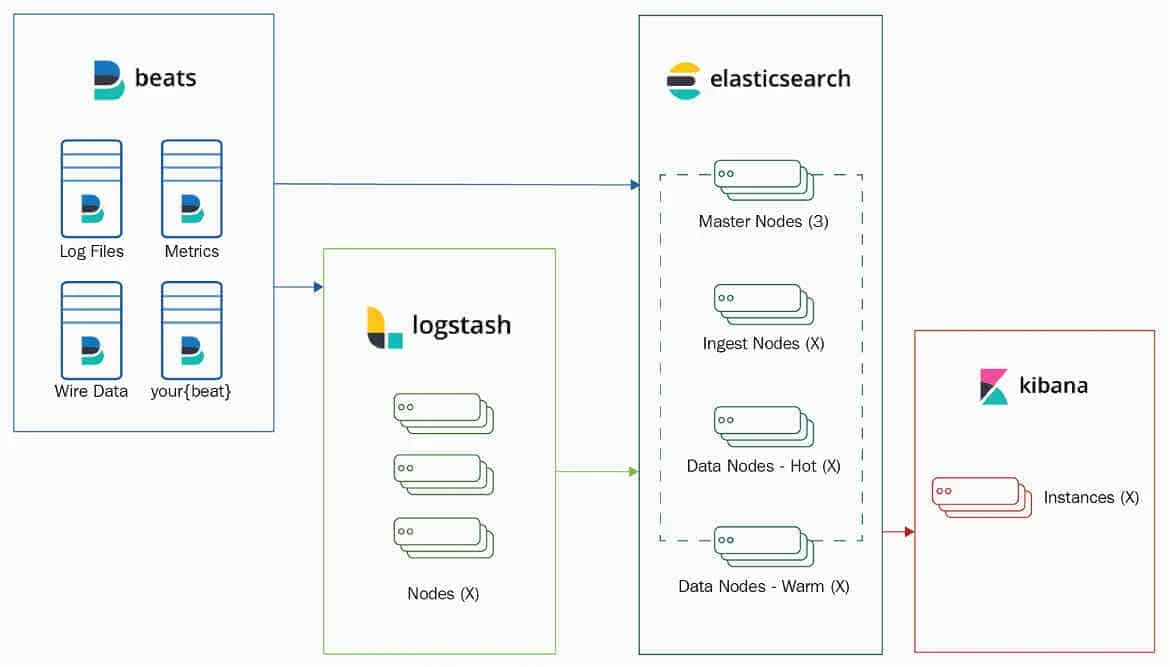
Credits: Lerning Kibana 7
Introducing Beats
Beats are lightweight data shippers that are installed as agents on edge servers to ship operational data to Elasticsearch. Just like Elasticsearch, Logstash, Kibana, and Beats are open source products too. Depending on the use case, Beats can be configured to ship the data to Logstash to transform events prior to pushing the events to Elasticsearch.
Elastic.co has built and maintained several Beats, such as Filebeat, Packetbeat, Metricbeat, Heartbeat, and Winlogbeat.
In this article we will share the steps to configure metricbeat to monitor elasticsearch cluster nodes on Kibana
Generate SSL Certificates
We will use the existing PEM certificates
we had created earlier for our ELK stackto configure metricbeat
over SSL. Create a directory elasticsearch under /etc/pki
# mkdir /etc/pki/elasticsearch
You can use any other location to store the certificates with enough
read permission. For example on server1 I will place all the server1
and CA certificates under /etc/pki/elasticsearch
[root@server1 ~]# ls -l /etc/pki/elasticsearch/
total 12
-rw-r--r--. 1 root root 1200 Dec 27 20:08 ca.crt
-rw-r--r--. 1 root root 1196 Dec 26 06:25 server1.crt
-rw-r--r--. 1 root root 1675 Dec 26 06:25 server1.key
Similarly on server2 and server3 keep the certificates we created
for respective server.
Overview on Metricbeat
- Metricbeat is a lightweight shipper that periodically collects metrics from the operating system and from services running on the server.
- It helps you monitor servers by collecting metrics from the system and services such as Apache, MondoDB, Redis, and so on, that are running on the server.
- Metricbeat can push collected metrics directly into Elasticsearch or send them to Logstash, Redis, or Kafka.
- To monitor elasticsearch cluster services, Metricbeat can be installed on the edge server where services are running; it provides you with the ability to collect metrics from a remote server as well.
- However, it's recommended to have it installed on the edge servers where the services are running to monitor elasticsearch cluster.
Install Metricbeat
There are various methods to install metricbeat, we will use the rpm method
[root@server1 ~]# curl -L -O https://artifacts.elastic.co/downloads/beats/metricbeat/metricbeat-7.5.1-x86_64.rpm
  % Total    % Received % Xferd  Average Speed   Time    Time     Time  Current
                                 Dload  Upload   Total   Spent    Left  Speed
100 34.1M  100 34.1M    0     0  6796k      0  0:00:05  0:00:05 --:--:-- 7537k

[root@server1 ~]# rpm -vi metricbeat-7.5.1-x86_64.rpm
Preparing packages...
metricbeat-7.5.1-1.x86_64
Configure MetricBeat
Configure metricbeat.yml
The main configuration file for metricbeat is metricbeat.yml available
under /etc/metricbeat. You configure Metricbeat to write to a specific
output (elasticsearch cluster nodes) by setting options in the Outputs
section of the metricbeat.yml config file
output.elasticsearch:
  hosts: ["https://server1.example.com:9200", "https://server2.example.com:9200", "https://server3.example.com:9200"]
  #Optional protocol and basic auth credentials.
  #protocol: "https"
  username: "elastic"
  password: "Passw0rd"
  ssl.certificate_authorities: ["/etc/pki/elasticsearch/ca.crt"]
Here,
- hosts: The list of Elasticsearch nodes to connect to. The events are distributed to these nodes in round robin order. If one node becomes unreachable, the event is automatically sent to another node. Each Elasticsearch node can be defined as a URL or IP:PORT.
- username: The basic authentication username to connect and monitor elasticsearch cluster.
- password: The basic authentication password to connect and monitor elasticsearch cluster.
- ssl.certificate_authorities: Provide the CA certificate path used
to sign the server certificate. Without this you may get
"
x509: certificate signed by unknown authority" error.
Configure Kibana endpoint
Starting with Metricbeat 6.0.0, the Kibana dashboards are loaded into Kibana via the Kibana API. This requires a Kibana endpoint configuration.
You configure the endpoint in the setup.kibana section of the
metricbeat.yml config file. Here 192.168.0.14 is our Kibana server's
IP
setup.kibana:
  host: "https://192.168.0.14:5601"
This is the Kibana server where dashboards will be loaded. Since our
Kibana server is using SSL hence I have used https.
Enable x-pack monitoring in Metricbeat
Since we plan to use x-pack monitoring we will turn this option to
true. If you wish to choose Internal Monitoring then you can set
this value to false.
monitoring.enabled: true
Sample metricbeat.yml config file
Below is my sample metricbeat.yml config file.
[root@server1 ~]# vim /etc/metricbeat/metricbeat.yml
metricbeat.config.modules:
  path: ${path.config}/modules.d/*.yml
  reload.enabled: false

setup.template.settings:
  index.number_of_shards: 1
  index.codec: best_compression

setup.kibana:
  # Kibana Host
  host: "https://192.168.0.14:5601"

output.elasticsearch:
  # Array of hosts to connect to.
  hosts: ["https://server1.example.com:9200", "https://server2.example.com:9200", "https://server3.example.com:9200"]

  # Optional protocol and basic auth credentials.
  #protocol: "https"
  username: "elastic"
  password: "redhat"
  ssl.certificate_authorities: ["/etc/pki/elasticsearch/ca.crt"]

processors:
  - add_host_metadata: ~
  - add_cloud_metadata: ~
  - add_docker_metadata: ~
  - add_kubernetes_metadata: ~

monitoring.enabled: true

setup.template.settings:
  index.number_of_shards: 1
  index.codec: best_compression
Configure elasticsearch.yml to enable x-pack monitoring
The Elasticsearch monitoring features use ingest pipelines, therefore
the cluster that stores the monitoring data must have at least one
ingest node. Disable the default collection of Elasticsearch monitoring
metrics. Set xpack.monitoring.elasticsearch.collection.enabled to
false on the production cluster.
xpack.monitoring.elasticsearch.collection.enabled: false
To receive elasticsearch collection data using filebeat you can also add
xpack.monitoring.collection.enabled: true
Enable module to monitor elasticsearch cluster
You can configure metricbeat to monitor various
services using different modules. The modules.d directory
contains default configurations for all the modules available in
Metricbeat. In our ELK Stack we plan to monitor elasticsearch cluster
using Metricbeat so we will enable elasticsearch-xpack module
[root@server1 ~]# metricbeat modules enable elasticsearch-xpack
Enabled elasticsearch-xpack
Next provide the details of the individual elasticsearch cluster host on
which you install the metricbeat. Below is an example output from
server1 node. Repeat the
same on all the cluster nodes.
[root@server3 server3]# cat /etc/metricbeat/modules.d/elasticsearch-xpack.yml
# Module: elasticsearch
# Docs: https://www.elastic.co/guide/en/beats/metricbeat/7.5/metricbeat-module-elasticsearch.html

- module: elasticsearch
  metricsets:
    - ccr
    - cluster_stats
    - enrich
    - index
    - index_recovery
    - index_summary
    - ml_job
    - node_stats
    - shard
  period: 10s
  hosts: ["https://server1.example.com:9200"]
  username: "elastic"
  password: "Passw0rd"
  ssl.certificate_authorities: ["/etc/pki/elasticsearch/ca.crt"]
  xpack.enabled: true
Since we have configured Elasticsearch to use encrypted communications, we must access it via HTTPS. If Elastic security features are enabled, you must also provide a user ID and password so that Metricbeat can collect metrics successfully. I will use elastic in-built user for this purpose.
Optional: Disable the system module in Metricbeat.
By default, the system module is enabled. The information it collects, however, is not shown on the Monitoring page in Kibana. Unless you want to use that information for other purposes, run the following command:
# metricbeat modules disable system
Since we are using CentOS environment where we use systemd to manage all our services. So we will use systemctl to start metricbeat service
[root@server1 ~]# systemctl start metricbeat
Also enable the service to to start this automatically post reboot
[root@server1 ~]# vim systemctl enable metricbeat
Test the Metricbeat installation
Login to your Kibana dashboard using any browser and click on
"Stack Monitoring" in the left panel
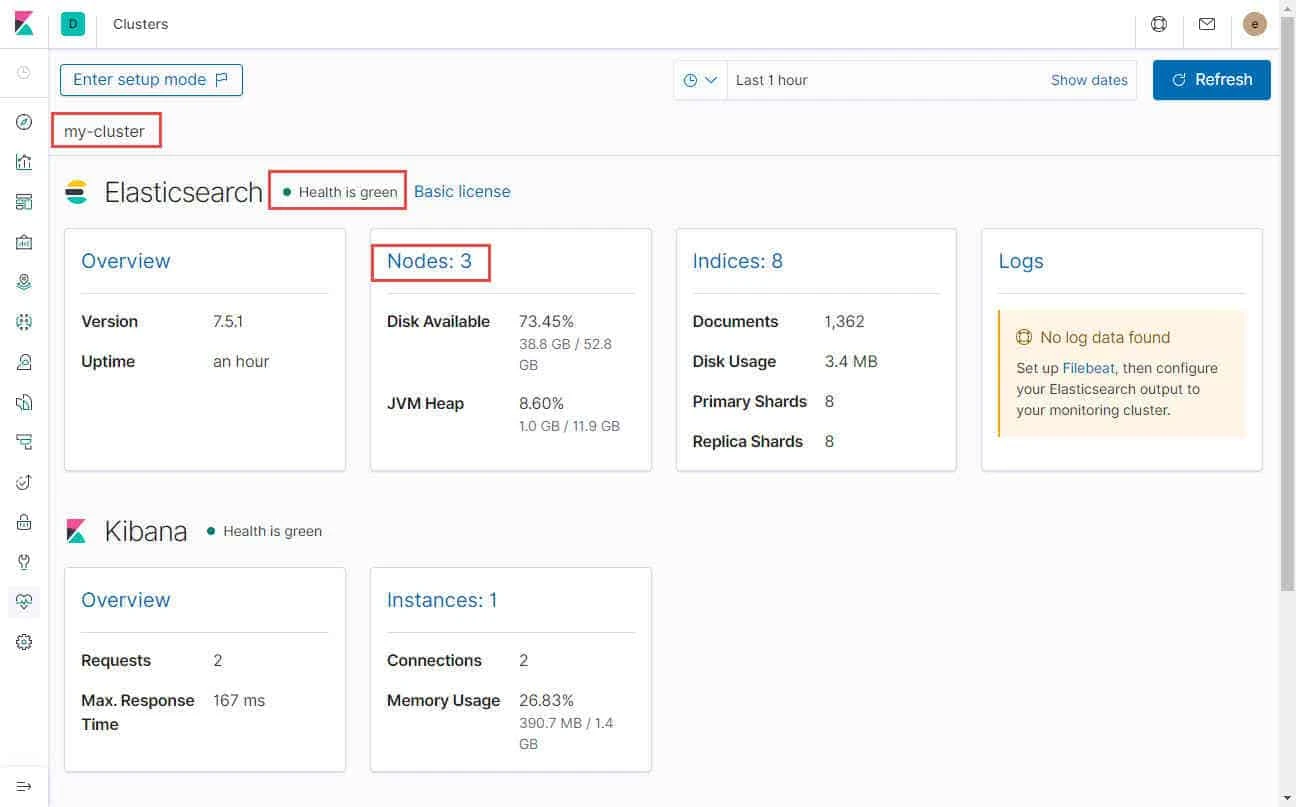
As you see, my-cluster is visible and has detected three nodes.
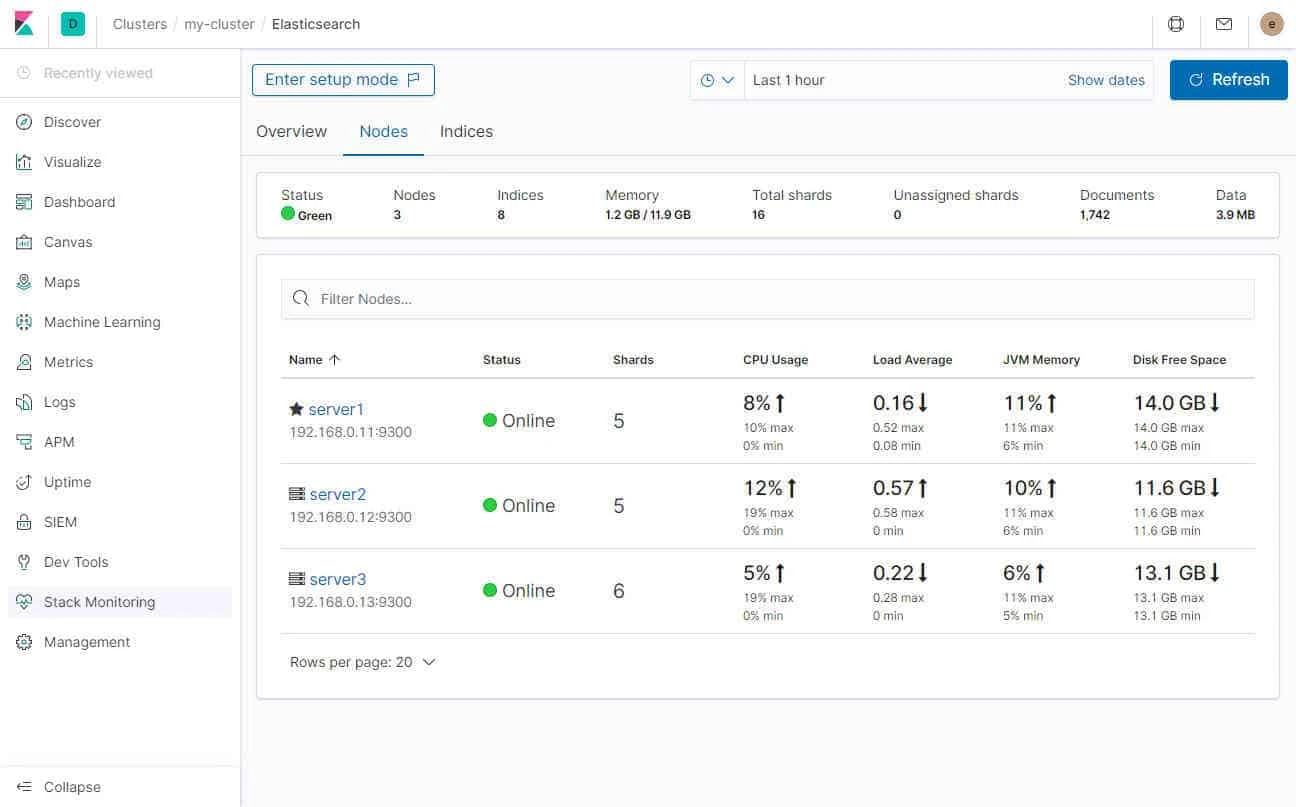
And all of them are being monitored successfully using metricbeat. You can click on individual cluster node to get more data.
To verify that your server’s statistics are present in Elasticsearch, issue the following command:
[root@server3 ~]# curl --cacert /etc/elasticsearch/certs/ca.crt -u elastic -XGET 'https://192.168.0.11:9200/metricbeat-*/_search?pretty' |less
<Output trimmed>
        "_index" : "metricbeat-7.5.1-2019.12.27-000001",
        "_type" : "_doc",
        "_id" : "jp3LR28Ba1N9j5AYYH1s",
        "_score" : 1.0,
        "_source" : {
          "@timestamp" : "2019-12-27T14:38:27.163Z",

          "agent" : {
            "type" : "metricbeat",
            "ephemeral_id" : "fbe9961f-1575-485e-a3a4-8fc375956611",
            "hostname" : "server2.example.com",
            "id" : "c2a87e15-cb9a-4b29-a546-82b33e43c4d7",
            "version" : "7.5.1"
          },
<Output trimmed>
Troubleshooting Common Errors:
Below are some errors which I faced when trying to configure metricbeat to monitor elasticsearch cluster
Error: x509: certificate signed by unknown authority
error: error making http request: Get https://192.168.0.14:5601/api/status: x509: certificate signed by unknown authority
Solution:
Since we are using a self signed certificate the ELK Stack service may
complain of this error message while trying to establish connection.
Here you have to check which service is throwing this error in
/var/log/messages
In this article I was getting this error for Kibana and Metricbeat which
is why I have explicitly defined the CA certificate (ca.crt) file's
location in both the configuration files which I used to sign all other
certificates.
Error: Unable to find the cluster in the selected time range. UUID:<Cluster_UUID>
Unable to find the cluster in the selected time range. UUID:<Cluster_UUID>
Solution:
There is no single way to know the solution of this problem as this can
occur due to various reasons. By default Kibana will attempt to connect
to elasticsearch cluster every 10 second which sometimes is not enough
so you can try to increase this value
To increase cluster timeout you can either modify your
elasticsearch.xml file and add below setting on all the cluster node's
which are reporting this issue on Kibana
xpack.monitoring.collection.cluster.stats.timeout: '30s'
Or you can send API request to your cluster nodes
# curl --cacert /etc/elasticsearch/certs/ca.crt -u elastic -X PUT "https://server3.example.com:9200/_cluster/settings?pretty" -H 'Content-Type: application/json' -d'
{
  "persistent": {
    "xpack.monitoring.collection.cluster.stats.timeout": "30s"
  }
}
'
If the above didn't solved your problem then I am afraid you will have to further look out for errors in respective Kibana, metricbeat service to understand the root cause using journalctl
# journalctl -u service.name
Press Ctrl+G to come to the end of the file and observe the log
messages.
Also check metricbeat status for any errors, here replace 192.168.0.13 with your cluster node IP/hostname and change the cert file location if using HTTPS
# curl --cacert /etc/elasticsearch/certs/ca.crt -u elastic:redhat -XGET 'https://192.168.0.13:9200/metricbeat-*/_search?pretty' | less
If everything looks correct you can raise a support ticket with elastic for experts to help you out debug the problem
Lastly I hope the steps from the article to configure metricbeat to monitor elasticsearch cluster on RHEL/CentOS 7/8 Linux was helpful. So, let me know your suggestions and feedback using the comment section.