Prometheus metrics tell you that reconciles are slow; distributed traces show where time went—Kubernetes API fan-out, SSA conflicts, or a cloud SDK call. This guide is for Go operators built with controller-runtime (sigs.k8s.io/controller-runtime): wiring the OpenTelemetry Go SDK, keeping context.Context authoritative, and avoiding the two classic mistakes—tracing every cache read and melting your apiserver with full sampling at high QPS.
Prerequisites: a working Reconcile loop, familiarity with controller-runtime architecture, and logs you can already grep (debugging operators). A production install also needs an OpenTelemetry Collector and a trace backend such as Tempo, Jaeger, or a vendor APM, but you can validate the operator code locally with the stdout exporter before deploying anything.
What you will build
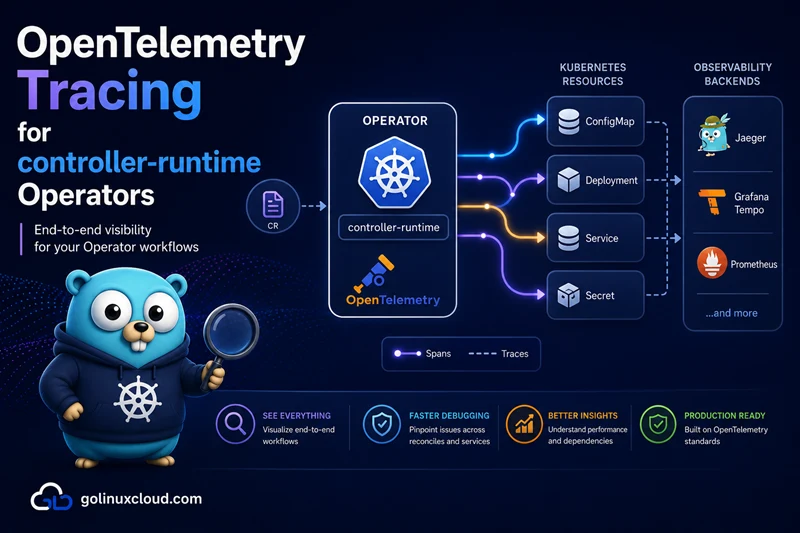
The practical path is:
Reconcile(ctx, request)
  -> root span named reconcile
  -> child spans for external calls or expensive stages
  -> otelhttp/otelgrpc spans for outbound clients
  -> OTLP exporter
  -> OpenTelemetry Collector
  -> Tempo, Jaeger, or vendor trace backend
This article focuses on operator-side instrumentation. It does not install a full tracing backend, and it does not replace Prometheus metrics. Metrics stay responsible for alerting and rates; traces explain one sampled reconcile in detail.
I tested the Go snippets with current OpenTelemetry modules in a temporary Go module:
go.opentelemetry.io/otel v1.44.0
go.opentelemetry.io/contrib/instrumentation/net/http/otelhttp v0.69.0
go.opentelemetry.io/otel/exporters/stdout/stdouttrace v1.44.0
go.opentelemetry.io/otel/sdk v1.44.0
One important result from that test: do not copy old semantic convention import paths blindly. The initial test failed with a schema conflict when semconv/v1.37.0 was mixed with newer SDK defaults. The working snippet used semconv/v1.41.0 with the current SDK.
For Kubernetes deployment commands, I dry-ran the environment-variable patch against an existing kind operator deployment named demoapp-operator-controller-manager in namespace demoapp-operator-system. Replace those names with your operator's deployment and namespace.
Step 1: Decide where tracing helps
What traces add on top of metrics
- Latency composition: one p99 reconcile time series does not show whether you spent 400ms in
Patch, 200ms waiting on workqueue batching, or 50ms in Go CPU. - Fan-out: multi-resource operators often issue dozens of
Get/List/Patchcalls per loop. A trace makes redundant calls obvious. - External systems: Vault, AWS, Git, SaaS APIs—wrap them in spans and tie them to the same trace id as the Kubernetes work.
Symptom → signal (quick map)
| Symptom | Start with | Add tracing when |
|---|---|---|
| Error rate spikes | Metrics + logs | You need the failing branch path inside reconcile |
| p99 reconcile high | Histogram metrics | You need per-call attribution (which API or HTTP client) |
| 429 / throttling | rest_client_* metrics |
You need to see which sequence of calls bursts QPS |
| "Works on my laptop" | kind + logs | You compare staging vs prod span shapes |
Natural span boundary
Treat one invocation of Reconcile as the default root span (one span from Reconcile entry to return). Watches and resyncs enqueue work; the workqueue delivers a reconcile—that unit is what operators think in, and it lines up with controller_runtime_reconcile_time_seconds buckets.
Step 2: Wire the OTel SDK in the manager process
Bootstrap order
- Build resource attributes (
service.name,service.version, optionalk8s.pod.namefrom downward API). - Create exporter (typically OTLP gRPC or HTTP to a collector sidecar or in-cluster service).
- Create
TracerProviderwith batch span processor + sampler. otel.SetTracerProvider(tp)before you construct the Manager so any early client calls inherit the same provider.- On shutdown,
Shutdown(ctx)the provider in parallel withmgr.Startteardown (flush pending spans).
Where it lives in your repo
Keep OTel init in main.go (or cmd/main.go) next to ctrl.Options{}—same place you already tune metrics bind address. Controllers receive a Tracer via closure or a small package-level Tracer("myorg.io/myoperator")—avoid scattering otel.Tracer string literals.
Minimal tested bootstrap
Use stdout first so you can prove spans are created before you add a Collector. This snippet compiled and ran with the module versions listed above:
package main

import (
    "context"

    "go.opentelemetry.io/otel"
    "go.opentelemetry.io/otel/exporters/stdout/stdouttrace"
    "go.opentelemetry.io/otel/propagation"
    "go.opentelemetry.io/otel/sdk/resource"
    sdktrace "go.opentelemetry.io/otel/sdk/trace"
    semconv "go.opentelemetry.io/otel/semconv/v1.41.0"
)

func newTracerProvider(ctx context.Context, serviceName, version string) (*sdktrace.TracerProvider, error) {
    exp, err := stdouttrace.New(stdouttrace.WithPrettyPrint())
    if err != nil {
        return nil, err
    }

    res, err := resource.Merge(
        resource.Default(),
        resource.NewWithAttributes(
            semconv.SchemaURL,
            semconv.ServiceName(serviceName),
            semconv.ServiceVersion(version),
        ),
    )
    if err != nil {
        return nil, err
    }

    tp := sdktrace.NewTracerProvider(
        sdktrace.WithBatcher(exp),
        sdktrace.WithResource(res),
        sdktrace.WithSampler(sdktrace.ParentBased(sdktrace.TraceIDRatioBased(1.0))),
    )
    otel.SetTracerProvider(tp)
    otel.SetTextMapPropagator(propagation.TraceContext{})
    return tp, nil
}
Call it before ctrl.NewManager(...) and shut it down when the process exits:
ctx := context.Background()

tp, err := newTracerProvider(ctx, "demoapp-operator", "0.1.0")
if err != nil {
    setupLog.Error(err, "unable to initialize OpenTelemetry")
    os.Exit(1)
}
defer func() { _ = tp.Shutdown(context.Background()) }()

mgr, err := ctrl.NewManager(ctrl.GetConfigOrDie(), ctrl.Options{
    Scheme: scheme,
})
For production, replace the stdout exporter with OTLP gRPC or OTLP HTTP and point it at your Collector. The rest of the manager and reconciler code should not care which exporter is used.
Add a root span in Reconcile
Start one root span per reconcile call. Keep the span name low-cardinality and put object details in attributes:
func (r *DemoAppReconciler) Reconcile(ctx context.Context, req ctrl.Request) (result ctrl.Result, err error) {
    ctx, span := r.Tracer.Start(ctx, "reconcile",
        trace.WithAttributes(
            attribute.String("k8s.controller", "demoapp"),
            attribute.String("k8s.namespace", req.Namespace),
            attribute.String("k8s.name", req.Name),
            attribute.String("k8s.kind", "DemoApp"),
        ),
    )
    defer func() {
        if err != nil {
            span.RecordError(err)
        }
        span.End()
    }()

    traceID := span.SpanContext().TraceID().String()
    log := log.FromContext(ctx).WithValues("trace_id", traceID)
    log.Info("reconciling DemoApp")

    return ctrl.Result{}, nil
}
Sample output from the stdout validation shows one root span and the same trace_id in the log line:
reconcile=default/example trace_id=45d888a7cd0a550333d92cfac4441dd4
{
    "Name": "reconcile",
    "SpanContext": {
        "TraceID": "45d888a7cd0a550333d92cfac4441dd4",
        "TraceFlags": "01"
    },
    "Attributes": [
        {"Key": "k8s.controller", "Value": {"Value": "demoapp"}},
        {"Key": "k8s.namespace", "Value": {"Value": "default"}},
        {"Key": "k8s.name", "Value": {"Value": "example"}}
    ],
    "ChildSpanCount": 1
}
Tests and CI
Use sdktrace.NewTracerProvider(sdktrace.WithSampler(sdktrace.NeverSample())) in tests, or an in-memory exporter asserting span count for integration tests that care. Production wiring should never block pod readiness on exporter connectivity—OTLP exporters retry in the background; prefer degraded tracing over crash-looping.
Step 3: Propagate context into client calls
Rule
Every helper that talks to the API server or the network should accept ctx context.Context and pass it through. The span you start in Reconcile must be the parent of downstream HTTP spans.
Kubernetes client-go / controller-runtime
After ctrl.GetConfig() (or the rest.Config you pass into the manager), wrap the transport so client-go requests become child spans and carry W3C traceparent where the stack supports it:
cfg := ctrl.GetConfigOrDie()
cfg.WrapTransport = func(rt http.RoundTripper) http.RoundTripper {
    return otelhttp.NewTransport(rt)
}

mgr, err := ctrl.NewManager(cfg, ctrl.Options{
    Scheme: scheme,
})
Build the manager with this config so the delegating client, API reader, and RESTMapper traffic share the wrapper. If you only wrap the main client, direct clientset you constructed earlier might still bypass tracing—standardize on one construction path.
The test program verified otelhttp.NewTransport injects a W3C traceparent header into outbound HTTP requests and emits an HTTP client span under the reconcile trace:
"Name": "HTTP GET",
"Parent": {
    "TraceID": "45d888a7cd0a550333d92cfac4441dd4"
},
"Attributes": [
    {"Key": "http.request.method", "Value": {"Value": "GET"}},
    {"Key": "server.address", "Value": {"Value": "example.com"}},
    {"Key": "http.response.status_code", "Value": {"Value": 200}}
]
Outbound HTTP / gRPC
- HTTP:
go.opentelemetry.io/contrib/instrumentation/net/http/otelhttparound thehttp.Clientyou use for webhooks to external SaaS. - gRPC: use otelgrpc interceptors on dial options for any gRPC SDKs.
Goroutines
Never go func() { _ = r.doWork(context.Background(), ...) }() and expect continuity—pass ctx (or a child context.WithoutCancel only when you truly detach and accept orphan spans). Background workers should receive the manager's root context or a derived context cancelled on leader loss.
Step 4: Name spans and link logs with trace IDs
Span names (low cardinality)
| Span | Good name | Attributes (examples) |
|---|---|---|
| Root | reconcile |
k8s.controller, k8s.namespace, k8s.name, k8s.group, k8s.version, k8s.kind |
| API | kubernetes or client.patch |
http.method, k8s.resource (low-cardinality GVK string), http.status_code |
| External HTTP | http.client |
http.url scheme+host only—not full path with IDs if cardinality explodes |
OpenTelemetry semantic conventions for Kubernetes controllers are still evolving; staying consistent inside your org matters more than the exact string. Never put unbounded values (full UIDs, request bodies) into span names—use attributes or events.
Span events vs child spans
Use span.AddEvent("skipped: generation unchanged") for cheap milestones. Add a child span only when the subtree can fail independently or has meaningful duration (e.g. one helm call, one cloud API).
Logs ↔ traces
When you start the root span, read span.SpanContext().TraceID() and add it to structured log fields (adapt to your stack—zap, slog, or logr):
ctx, span := tracer.Start(ctx, "reconcile")
defer span.End()
traceID := span.SpanContext().TraceID().String()
// e.g. logr: log.WithValues("trace_id", traceID).Info(...)
If you use logr, bridge patterns exist to attach trace context automatically—pick one approach per codebase. In Loki/Elastic/GCP Logging, filter logs by trace_id then jump to the trace UI with the same id.
Step 5: Configure sampling and overhead controls
Head sampling (cheap, in-process)
ParentBased(AlwaysSample())during local dev.- Production default:
ParentBased(TraceIDRatioBased(0.01))for roots—1% of reconciles—then always sample errors by wrapping the sampler with a custom sampler that returnsRecordAndSamplewhenReconcilereturns an error (you can set span status indeferbefore end).
Exact error-biased sampling is easiest if you start the span at the top of Reconcile and call span.RecordError(err) on non-nil return—pair with a sampler that inspects span kind + status if you go advanced.
Tail sampling (collector)
For "keep slow traces > 2s" or "keep all errors," tail sampling in the OpenTelemetry Collector gives better signal than raising the in-process ratio—but adds memory until a trace completes. Link to upstream collector tail_sampling docs in your internal runbook.
A minimal Collector policy for slow traces and errors looks like this:
processors:
  tail_sampling:
    decision_wait: 10s
    num_traces: 10000
    expected_new_traces_per_sec: 100
    policies:
      - name: keep-errors
        type: status_code
        status_code:
          status_codes:
            - ERROR
      - name: keep-slow-reconciles
        type: latency
        latency:
          threshold_ms: 2000
Use this in the Collector, not inside the operator binary.
Deploy the operator with OTLP settings
For production, keep exporter settings in the Deployment so you can change the Collector endpoint or sample ratio without rebuilding the operator image:
kubectl set env deployment/demoapp-operator-controller-manager \
  -n demoapp-operator-system \
  OTEL_SERVICE_NAME=demoapp-operator \
  OTEL_EXPORTER_OTLP_ENDPOINT=http://otel-collector.observability.svc:4317 \
  OTEL_TRACES_SAMPLER=parentbased_traceidratio \
  OTEL_TRACES_SAMPLER_ARG=0.01
I validated the shape of this command with --dry-run=client -o yaml against the kind deployment. The generated container env block was:
env:
  - name: OTEL_SERVICE_NAME
    value: demoapp-operator
  - name: OTEL_EXPORTER_OTLP_ENDPOINT
    value: http://otel-collector.observability.svc:4317
  - name: OTEL_TRACES_SAMPLER
    value: parentbased_traceidratio
  - name: OTEL_TRACES_SAMPLER_ARG
    value: "0.01"
After applying this in a real cluster, confirm the rollout and then look for trace export errors in the operator logs:
kubectl rollout status deployment/demoapp-operator-controller-manager \
  -n demoapp-operator-system

kubectl logs -n demoapp-operator-system \
  deployment/demoapp-operator-controller-manager \
  --since=10m | grep -i otel
No log output from the second command can be fine if your exporter is healthy and quiet. Connection refused, DNS errors, or deadline exceeded messages usually mean the Collector Service name, port, or network policy is wrong.
Cost controls
- BatchSpanProcessor with sensible
MaxExportBatchSizeand timeouts. - Cardinality: one root per reconcile at 1% sampling still means thousands of spans/sec on huge clusters—watch apiserver LIST traffic; tracing does not create extra LISTs, but verbose span attributes on every watch reaction can still burn CPU in your process.
Step 6: Avoid noisy cache-path tracing
client vs Reader and the cache
controller-runtime's split client serves Get/List from cache for known types. Those calls are fast, frequent, and noisy. Wrapping them with a child span per Get usually produces unreadable traces and measurable CPU overhead.
Practical policy:
- Do wrap the REST calls you care about—or rely on one "reconcile" root span and let transport instrumentation aggregate HTTP without per-field spans.
- Do not add manual spans inside predicates, event handlers, or Enqueue—those run on the informer thread and can amplify with object churn.
Anti-patterns (short list)
- Child span for every
r.Getin a loop over fifty related objects. - Span around status equality checks or pure CPU diffing.
- Dumping full object YAML into attributes (size + secret leak risk).
When narrower tracing is enough
If transport-level HTTP spans are too noisy, disable client auto-instrumentation and keep only the root reconcile span plus hand-placed children on external calls only. You lose per-verb Kubernetes visibility but keep operator-relevant boundaries.
Step 7: Verify traces end to end
Use this quick path after deployment:
| Check | Command or query | Good result |
|---|---|---|
| Pod has OTEL env vars | kubectl get deploy <name> -n <ns> -o yaml |
OTEL_SERVICE_NAME and exporter endpoint are present |
| Operator still reconciles | Operator logs and metrics | No readiness failures or reconcile error spike |
| Collector receives data | Collector logs or self-metrics | No permanent exporter errors |
| Backend has service | Trace UI service selector | demoapp-operator appears |
| One trace has children | Open a sampled trace | reconcile root has external/API child spans |
| Logs correlate | Search logs by trace_id |
Same trace ID appears in logs and trace UI |
In a local stdout test, the fast sanity check is simply:
go run . | grep -E 'trace_id|"Name": "reconcile"|"Name": "HTTP GET"'Expected signal:
reconcile=default/example trace_id=45d888a7cd0a550333d92cfac4441dd4
"Name": "HTTP GET",
"Name": "reconcile",
Step 8: Production checklist
- TracerProvider shutdown wired to process exit.
- Root span per
Reconcilewith GVK + namespace + name attributes (bounded cardinality). -
ctxthreaded through all I/O; no accidentalcontext.Background()in hot paths. - Sampling chosen for worst-case reconcile QPS; error or slow paths still observable.
- Logs include
trace_id(or backend-native trace field). - Load test: CPU and apiserver 429 rate compared to tracing off.
Frequently Asked Questions
1. Does OpenTelemetry replace Prometheus metrics for my operator?
No. Metrics answer rates, histograms, and saturation; traces answer "which steps inside one reconcile were slow." Use both: keep controller-runtime Prometheus metrics for dashboards and alerts, add traces when you need latency breakdown or correlation across outbound calls.2. Should admission webhooks in the same binary use the same TracerProvider?
Usually yes—one process, one provider—so webhook spans share resource attributes with reconcile spans. Use a different tracer name (e.g.webhook vs controller) and optional sampler overrides if webhooks are far noisier than reconcile.3. How do I run tests without exporting spans?
In unit tests and envtest, register a no-op or in-memory exporter, or usesdktrace.NeverSample() for the test TracerProvider. Never require a running Collector for go test.See also
- Prometheus metrics for operators
- Health and readiness probes
- Debugging operators
- controller-runtime architecture
- Requeue and error handling
- OpenTelemetry Go
- OpenTelemetry Go instrumentation
- otelhttp transport
- OTLP specification
- OpenTelemetry Collector tail sampling processor
Bottom line: trace Reconcile as the product unit, propagate context into client-go (via WrapTransport) and outbound HTTP/gRPC, keep span names boring and attributes bounded, sample aggressively in hot controllers, and never instrument cache-hot paths at per-call granularity. Metrics stay the control tower; traces are the flight recorder you turn to when p99 or fan-out stops making sense.