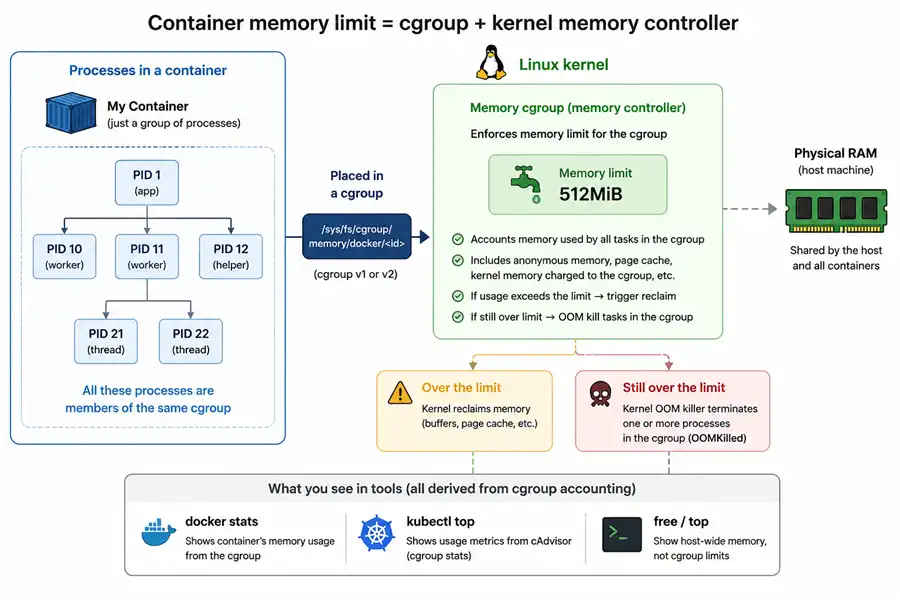
When you set a “memory limit” on a container, you are not creating a smaller machine with its own RAM bar. You are asking the Linux kernel to account a group of processes under a cgroup and to apply a cap using the cgroup memory controller. Everything else—docker stats, kubectl top, free, “it OOMKilled but looked fine”—flows from that fact.
If you want background on virtual memory, RSS, page cache, and the general OOM story on Linux, read the overview first: Linux memory management. This article stays focused on limits inside containers and how to read them.
The figure below is the mental model: processes in your container run under one cgroup, and the kernel’s memory controller applies the cap.
TL;DR: Why container memory numbers disagree
- Container limits are enforced by Linux cgroups, not by namespaces.
- The authoritative cap and current usage live in cgroup files such as
memory.max(cgroup v2) ormemory.limit_in_bytes/memory.usage_in_bytes(cgroup v1). - Process RSS is only part of what the memory controller can account toward the limit.
- Page cache, tmpfs, and other file-backed or kernel-attributed memory can also count toward the cgroup cap.
- In Kubernetes,
OOMKilledon a container usually means that container’s cgroup limit was exceeded; node eviction is a different mechanism (kubelet / node pressure).
What a container limit actually is
What we call a container is usually a normal process (or tree of processes) on the host, plus how the runtime configures the kernel around it. Two pieces matter for this article:
- Namespaces control what those processes see: separate PID tables, mount roots, network stacks, and so on. Namespaces are about isolation, not about how much RAM is allowed.
- cgroups control what those processes cost: accounting and limits for CPU, memory, I/O, and more. The memory limit enforced when a workload is “too big” is a cgroup setting, not a namespace setting.
Your runtime (containerd/CRI-O/Moby) joins the container processes to cgroup paths and writes the limit fields. The application still uses the host kernel’s memory manager: paging, reclaim, slab, page cache—all of it.
So when you debug “memory,” you should decide which question you mean:
- “What is my cgroup usage right now?” → cgroup files on the host (or a trusted agent)
- “What is this one process using?” →
/proc/<pid>/...(RSS and friends) - “What does Kubernetes metrics say?” → Metrics API / kubelet-derived series (not identical to either of the above)
Those can diverge legitimately.
cgroup v1 vs cgroup v2 (know which host you are on)
A lot of confusion comes from mixing v1 and v2 documentation. Check the host first.
cgroup v2 (unified hierarchy) is common on newer distributions. If this file exists, you are on v2:
test -f /sys/fs/cgroup/cgroup.controllers && echo "cgroup v2 (unified)" || echo "not unified v2 root layout"See which controllers are available at the root:
cat /sys/fs/cgroup/cgroup.controllers 2>/dev/null || trueSee what a specific process is attached to:
PID=1
cat /proc/$PID/cgroup- v1 lines look like
1:memory:/somethingand0::may be absent or less informative depending on setup. - v2 commonly shows
0::/init.scopestyle paths (single unified path).
If your site mixes hosts, always record OS, kernel, and cgroup version when you paste numbers in tickets. The files you open change completely.
Table: cgroup v1 vs v2—common memory files and concepts (exact names and availability depend on kernel and distribution).
| Concept | cgroup v1 | cgroup v2 |
|---|---|---|
/proc/self/cgroup example |
1:memory:/docker/<id> |
0::/docker/<id> or 0::/init.scope |
| Hierarchy model | Separate hierarchy per controller | Single unified hierarchy |
| Current memory usage | memory.usage_in_bytes |
memory.current |
| Peak memory usage | memory.max_usage_in_bytes |
memory.peak |
| Hard memory limit | memory.limit_in_bytes |
memory.max |
| Soft protection | memory.soft_limit_in_bytes |
memory.low |
| Strong memory protection | Not available | memory.min |
| Memory statistics | memory.stat |
memory.stat |
| Limit hit / OOM signals | memory.failcnt (counter); also use dmesg for OOM |
memory.events (oom, oom_kill, …) |
| Swap usage | memory.memsw.usage_in_bytes |
memory.swap.current |
| Swap limit | memory.memsw.limit_in_bytes |
memory.swap.max |
| Typical mount location | /sys/fs/cgroup/memory/ |
/sys/fs/cgroup/ |
On v1 hosts, treat memory.failcnt as a limit-pressure counter and rely on dmesg / kubelet or containerd logs for the same class of story that v2 exposes in memory.events.
Reading cgroup memory files on the host
cgroup v1. On v1 hosts you will often see a separate memory hierarchy mounted, historically under paths like /sys/fs/cgroup/memory.
Typical files (exact path depends on your layout):
memory.limit_in_bytes: cgroup memory limit (very large value often means “max” / no practical cap)memory.usage_in_bytes: usage tracked by the v1 memory controller (use together withmemory.statfor interpretation)memory.stat: breakdown keys (seememory.statkeys later in this section)- Swap coupling: v1 commonly exposes
memory.memsw.limit_in_bytes(memory+swap) on setups that track it—verify on your host; swap behavior is a frequent source of “it died differently on two machines” reports
Print a few key fields quickly (adjust the cgroup path to your system):
CGROUP_MEM_PATH="/sys/fs/cgroup/memory/user.slice/user-1000.slice/session-1.scope"  # example only

test -d "$CGROUP_MEM_PATH" || { echo "Edit CGROUP_MEM_PATH to a real v1 memory cgroup"; exit 1; }

echo -n "memory.limit_in_bytes: "; cat "$CGROUP_MEM_PATH/memory.limit_in_bytes"
echo -n "memory.usage_in_bytes: "; cat "$CGROUP_MEM_PATH/memory.usage_in_bytes"

echo "--- memory.stat (first lines) ---"
head -n 30 "$CGROUP_MEM_PATH/memory.stat"
cgroup v2. On v2, memory control is exposed under the unified cgroup path for the container.
Common files:
memory.max: hard cap (maxmeans no cap)memory.high: soft throttle point (if set, pressure can show up before hard cap)memory.current: current usage accounted to the cgroupmemory.swap.current/memory.swap.max: swap accounting and cap (maxmeans no cap)memory.stat: breakdown keys (kernel version affects which keys exist)memory.events: includes counters likeoom/oom_kill(useful evidence)
Show the headline fields (adjust path):
CGROUP_V2_PATH="/sys/fs/cgroup/user.slice/user-1000.slice/session-1.scope"  # example only

for f in memory.max memory.high memory.current memory.swap.max memory.swap.current; do
  if test -f "$CGROUP_V2_PATH/$f"; then
    echo -n "$f: "
    cat "$CGROUP_V2_PATH/$f"
  fi
done

echo "--- memory.events ---"
cat "$CGROUP_V2_PATH/memory.events" 2>/dev/null || true

echo "--- memory.stat (first lines) ---"
head -n 40 "$CGROUP_V2_PATH/memory.stat"
PSI (optional but very useful on v2): if present, memory.pressure can show pressure before a hard OOM. Not every minimal environment mounts PSI, but when it exists it helps explain slowdowns.
cat /sys/fs/cgroup/<your-cgroup>/memory.pressure 2>/dev/null || echo "PSI not available here"memory.stat keys (v1 and v2). Exact semantics evolve with kernels, but for day-to-day triage you usually care about:
anon: anonymous mappings (often what people mean by “heap-ish” growth)file: file-backed memory attributed to the cgroup (includes mappings; interpret alongside workload I/O)kernel_stack,slab(when present): kernel structures attributable to the cgroup’s workload footprint (useful when people blame “slab” spikes)
Pull the big lines:
CGROUP_PATH="/sys/fs/cgroup/REPLACE_ME"
grep -E '^(anon|file|kernel_stack|slab|sock|shmem)\b' "$CGROUP_PATH/memory.stat" 2>/dev/null
If anon is flat but file climbs while you read lots of data from disk inside the container, you should not be surprised if cgroup usage grows even when top “RSS” looks stable.
cgroup memory vs process RSS
This part answers a common incident question: RSS looked under the limit, so why did the cgroup kill the container or show high usage?
The cgroup memory controller accounts for the total memory footprint of the workload inside the cgroup, not just the RSS of one process. That footprint includes effects that do not show up the way people read top.
When someone says “the process RSS was below the limit,” they might still hit cgroup pressure because:
- File-backed memory and cache-like effects can count toward the cgroup in ways users do not track if they only watch
RESintop. - Shared memory and mappings can make “sum of per-process RSS” math disagree with cgroup accounting.
- tmpfs usage can surprise people (it is still real memory pressure).
You do not need to memorize every kernel corner case. For triage, use a simple habit:
- Look at
memory.current(v2) ormemory.usage_in_bytes(v1) together withmemory.stat. - Compare that to per-process
/proc/<pid>/status(VmRSS, etc.) when you need ground truth for one PID.
For deeper per-process fields (VmRSS, smaps_rollup, PSS vs RSS), see how to check memory usage per process in Linux. That guide is host-oriented; in a container, always pair it with cgroup totals so you do not confuse process RSS with the pod memory cap.
Slab, page cache, reclaim. Linux will reclaim page cache and other reclaimable memory when pressure builds. That does not contradict cgroup limits: pressure and accounting still show up in cgroup counters and in latency, even if some memory is reclaimable in principle. For incidents, avoid folklore—stick to cgroup memory.current and memory.stat, latency and throttle signals (memory.high, PSI if available), and disk I/O patterns when file grows.
Demo: How to read memory of a container effectively
Building on the RSS–versus–cgroup split in the previous section, this walkthrough interprets memory in three layers without mixing them up—cluster or platform summaries (oc adm top pods / kubectl top pod), cgroup counters (memory.usage_in_bytes or v2 memory.current plus memory.stat), and per-process RSS from ps or /proc. The goal is not to memorize every field; it is to show that a high number in the first layer does not, by itself, mean the workload is about to run out of RAM. You only know that after you see what the cgroup is counting (especially cache vs anonymous) and how that lines up with process RSS.
We walk a real OpenShift scrape where oc adm top sits near a 1550 Mi limit while the main process RSS is only a few hundred MiB and memory.stat shows substantial cache and inactive file. We then add a short synthetic ramp in the same style of environment so you can see reclaim: cache headroom shrinks, totals move, then drop after the process stops. After that split, a high line in oc adm top is easier to read as “cgroup working set + cache context,” not automatically a paging emergency—the cap that matters for OOM-style pressure is whether anonymous / process memory is what is consuming the limit.
Red Hat’s note on what “cache” means in free and why “used” can look high matches this pattern: much of what looks like “used” memory can be reclaimable cache. For cgroup v1 accounting differences across OS minors, see also this memory.usage_in_bytes / kmem discussion.
The demo is intentionally split: start with what operators see from the cluster and from process tools, then validate cgroup files on the node, then simulate load to watch counters move.
Check platform and application memory
Example project app-demo, StatefulSet-style replicas with a 1550 Mi memory limit (names anonymized; Mi values are from a real measurement):
# oc adm top po -n app-demo | grep warehouse

warehouse-admin-7468d6bdb7-zf6hj   9m    248Mi
warehouse-db-0                     12m   1094Mi
warehouse-db-1                     10m   1495Mi
warehouse-db-2                     9m    1464Mi
warehouse-proxy-0                  42m   133Mi
warehouse-proxy-1                  17m   130Mi
The three warehouse-db-* pods sit at about 1.1–1.5 GiB in this scrape—on the order of 90% of 1550 Mi, which is close enough to the configured limit that many engineers would suspect an imminent OOM.
Inside one of those pods, per-process RSS from ps (and top for the same PID) is the second layer:
oc exec -it -n app-demo warehouse-db-0 bash
ps -eo pid,ppid,cmd,%mem,%cpu,rss,vsz --sort=-rss | head -n 8
Pick the main workload PID from the top of that list (here PID 589). Example line (command shortened):
589 1 /usr/sbin/dbengine --user=… … … 231376 …RSS 231376 KB is about 226 MiB for that single process. top shows the same ballpark for PID 589 (RES 231376 KB). The main daemon is not holding ~1.1 GiB of anonymous heap by itself.
Validate cgroup totals and memory.stat
On the node, cgroup v1 memory.usage_in_bytes and memory.stat are the third layer—for that pod’s memory cgroup:
cat /sys/fs/cgroup/memory/memory.usage_in_bytesObserved:
12371107841237110784 / (1024×1024) ≈ 1180 MiB, in the same ballpark as oc adm top for warehouse-db-0 (1094 Mi in this scrape; small gaps are normal between scrape time and what usage_in_bytes counts).
cat /sys/fs/cgroup/memory/memory.stat | egrep "rss|cache|inactive_file|slab"Observed subset (same numbers as in the measurement; add slab on your system if the key exists):
cache 103522304
rss 335872000
inactive_file 87760896
Rough MiB (bytes / 1024²): rss ~320, cache ~99, inactive_file ~84. The cgroup rss line is resident memory summed over all processes in the pod, so it is larger than the ~226 MiB of the main PID alone, but still far below ~1180 MiB usage_in_bytes. The rest of memory.usage_in_bytes is not fully described by those three egrep lines; it also includes other file-backed and kernel-charged lines (read the full memory.stat, including slab where present). That is the metrics look full, process RSS looks small pattern: much of what the platform reports is cache and reclaimable-style memory, not extra heap in the one process at the top of ps.
Simulate memory load and reclaim
A stepped Python allocator in the same cgroup v1 environment (same limit class as above; touch every 4 KiB page so faults are real) shows reclaim when anonymous pressure appears:
import time

blocks = []
for i in range(1, 8):
    b = bytearray(150 * 1024 * 1024)
    b[::4096] = b"x" * (len(b) // 4096)
    blocks.append(b)
    print(f"{i * 150} MB allocated")
    time.sleep(0.1)

print("Holding memory...")
time.sleep(300) # stop with Ctrl+C when doneOn the node, memory.usage_in_bytes and memory.stat were sampled in a loop. Abbreviated lines from that run:
2026-03-25 06:35:34 | Total: 985 MB | RSS: 298 MB | Cache: 27 MB | Inactive: 19 MB | …
2026-03-25 06:35:43 | Total: 1541 MB | RSS: 1051 MB | Cache: 24 MB | Inactive: 17 MB | …
2026-03-25 06:35:44 | Total: 1532 MB | RSS: 1351 MB | Cache: 18 MB | Inactive: 11 MB | …
2026-03-25 06:36:02 | Total: 476 MB | RSS: 298 MB | Cache: 18 MB | Inactive: 11 MB | …
While the allocator ran, total and cgroup RSS moved up toward the cap; cache dropped as the kernel reclaimed headroom. After Ctrl+C, total fell quickly (example tail ~476 MiB). So even when oc adm top had looked almost full in steady state, adding anonymous pressure showed reclaim working and usage coming back down when the load stopped—not the same story as an unavoidable OOMKilled.
When to escalate
Treat oc adm top near the limit as a signal to open cgroup files and memory.stat, not as proof the application is out of RAM.
Worry more when cgroup rss and the main process RSS climb together with real workload growth and cache/inactive_file cannot explain the distance to the cap, or when you already see OOMKilled or cgroup OOM evidence (see the OOM in containers: what to collect in five minutes section below).
If process RSS is stable and cache, inactive_file, and slab explain most of usage_in_bytes, focus on I/O, reclaim, and limits policy before resizing the pod; Red Hat’s cache vs “used” memory is the usual reference for that conversation.
Optional Docker experiments
Beside the Python ramp above, these are short checks on a laptop. They reuse the Docker cgroup workflow from the Docker section next: start a capped container, resolve its cgroup on the host from docker inspect + /proc/<pid>/cgroup, then read memory.current / memory.stat (v2) or memory.usage_in_bytes / memory.stat (v1) before and after the workload step.
On cgroup v2 hosts, the cgroup directory is usually the 0::… line from /proc/<pid>/cgroup joined with /sys/fs/cgroup (same awk snippet as in that Docker section). If you only see a memory: controller line (v1-style hybrid), open that path under /sys/fs/cgroup/memory/… instead.
Use a throwaway name (memlab-*) so you do not collide with real containers.
Page cache without heap growth
docker rm -f memlab-cache 2>/dev/null
docker run -d --name memlab-cache -m 512m alpine:3.20 sleep 600

CID="$(docker ps -qf name=memlab-cache)"
PID="$(docker inspect --format '{{.State.Pid}}' "$CID")"
REL="$(awk -F: '$2=="" {print $3}' /proc/$PID/cgroup)"
CGROUP_PATH="/sys/fs/cgroup$REL"
echo "pid=$PID cgroup=$CGROUP_PATH"

# v2 headline + file vs anonymous (v1: use rss/cache/inactive_file lines instead)
grep -E '^(anon|file)\b' "$CGROUP_PATH/memory.stat" 2>/dev/null || true

docker exec memlab-cache sh -lc '
  dd if=/dev/zero of=/tmp/big bs=1M count=200 status=none
  sync
  cat /tmp/big >/dev/null
  cat /tmp/big >/dev/null
  echo warmed
'

grep -E '^(anon|file)\b' "$CGROUP_PATH/memory.stat" 2>/dev/null || true
docker rm -f memlab-cache
You normally see file (v2) or cache / inactive_file (v1) move while process RSS stays modest compared to the headline cgroup total—similar to “restore or scan lots of files” in a real database pod.
tmpfs counts toward the cap
docker rm -f memlab-shm 2>/dev/null
docker run -d --name memlab-shm -m 256m alpine:3.20 sleep 600

CID="$(docker ps -qf name=memlab-shm)"
PID="$(docker inspect --format '{{.State.Pid}}' "$CID")"
REL="$(awk -F: '$2=="" {print $3}' /proc/$PID/cgroup)"
CGROUP_PATH="/sys/fs/cgroup$REL"

docker exec memlab-shm sh -lc 'dd if=/dev/zero of=/dev/shm/x bs=1M count=180 status=none; echo shm-written'

grep -E '^(anon|file)\b' "$CGROUP_PATH/memory.stat" 2>/dev/null || true
cat "$CGROUP_PATH/memory.current" 2>/dev/null || cat "$CGROUP_PATH/memory.usage_in_bytes" 2>/dev/null || true
docker rm -f memlab-shm
That memory is easy to forget in spreadsheets because it is not always what people picture as “application RSS,” yet it is charged to the cgroup.
Intentional cgroup OOM (scratch host only)
# Expect the container to be killed; exit code is often non-zero.
docker run --rm -m 64m alpine:3.20 sh -lc 'dd if=/dev/zero of=/dev/shm/fill bs=1M count=256 status=none'
echo "docker exit=$?"
Then align with the OOM in containers: what to collect in five minutes checklist below: memory.events on v2 (oom / oom_kill counters), dmesg on the host, and docker inspect / exit reason for the container. Do not run this on shared clusters.
Common container memory mistakes
| Mistake | Reality |
|---|---|
free shows 64 GB so my container has 64 GB |
/proc/meminfo inside many containers still reflects host totals; the cgroup cap is what the kernel enforces (memory.max / memory.limit_in_bytes). |
| My process RSS is 200 MB, so a 512 MB limit is safe | Page cache, tmpfs, shared mappings, and other cgroup lines can push memory.current / memory.usage_in_bytes much higher than one process's RSS. |
kubectl top equals RSS |
It reports Metrics API usage for the pod/container—not the same definition as ps RSS or every field in memory.stat. |
OOMKilled means the node ran out of memory |
Usually it means this container's cgroup exceeded its memory limit (unless you are conflating with node eviction). |
| Raising the limit always fixes OOM | A leak or unbounded growth can fill the new cap too; fix accounting and workload behavior, not only the number. |
Docker: find the cgroup on the host and match it to your flags
Goal: For a running container, locate the cgroup directory Docker (via containerd/runc) is using on the host, read the same limit and usage files the kernel enforces (memory.max / memory.current on v2, or the v1 equivalents), and line that up with what you configured (docker run -m, Compose mem_limit, and so on). The commands below are one concrete path to do that on a cgroup v2 host; on v1 you still start from /proc/<pid>/cgroup, then open the matching memory/ hierarchy.
Docker, Kubernetes, and other runtimes ultimately write the same cgroup memory files; only the cgroup path and which component applies the YAML/CLI values differ. The figure is the end-to-end mental model (CLI or YAML → runtime → cgroup files → kernel).
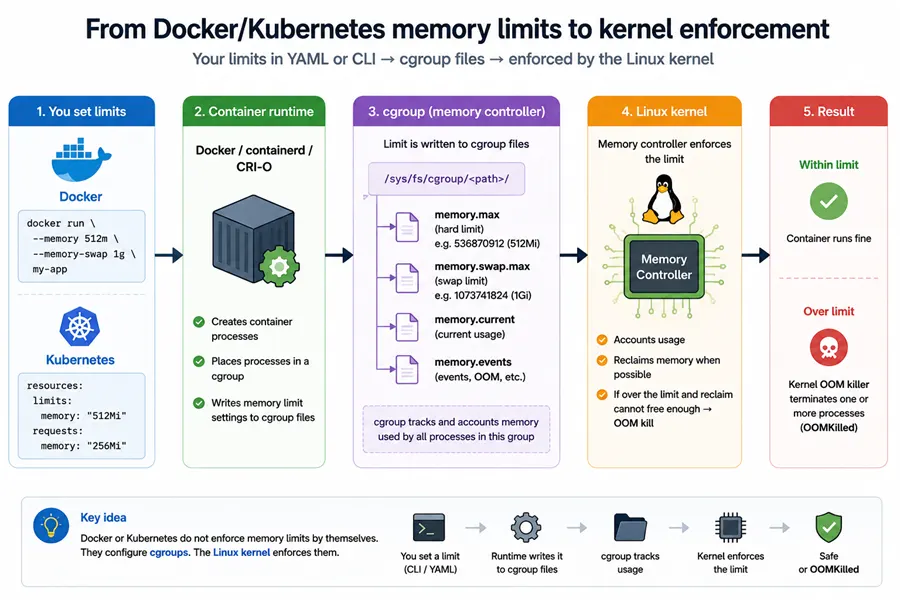
Step 1 — PID and /proc/.../cgroup. Pick a running container and print its main PID and the cgroup lines the kernel stores for that PID:
CID="$(docker ps -q | head -n 1)"
test -n "$CID" || { echo "No running container found"; exit 1; }

PID="$(docker inspect --format '{{.State.Pid}}' "$CID")"
echo "container=$CID pid=$PID"

echo "--- /proc/$PID/cgroup ---"
cat "/proc/$PID/cgroup"
Step 2 — Path under /sys/fs/cgroup (v2 example). On cgroup v2, /proc/<pid>/cgroup gives a relative path under the unified hierarchy. Join it with /sys/fs/cgroup so you have a directory you can cat:
PID="$(docker inspect --format '{{.State.Pid}}' "$CID")"
REL="$(awk -F: '$2=="" {print $3}' /proc/$PID/cgroup)"   # v2 line is often 0::<path>
echo "relative cgroup path: $REL"

ROOT="/sys/fs/cgroup"
CGROUP_PATH="$ROOT$REL"
echo "sysfs path: $CGROUP_PATH"

ls -1 "$CGROUP_PATH" | grep '^memory\.' | head
Step 3 — Limit and usage files.
cat "$CGROUP_PATH/memory.max" 2>/dev/null || true
cat "$CGROUP_PATH/memory.current" 2>/dev/null || true
head -n 30 "$CGROUP_PATH/memory.stat" 2>/dev/null || true
Compare memory.max (or v1 memory.limit_in_bytes) to what you expect from docker inspect (HostConfig.Memory) and from --memory / --memory-swap in the next paragraphs.
docker inspect, docker stats, swap flags, and cgroup files. docker stats is convenient, but when something serious happens, cgroup files are the definition of what the kernel enforced for that cgroup. Use docker stats for dashboards; use cgroup files for root cause.
Docker’s --memory sets the memory limit users talk about most. The --memory-swap flag controls the relationship between memory and swap accounting in Docker’s model. Before relying on swap behavior, print what Docker thinks it applied:
docker inspect --format 'Memory={{.HostConfig.Memory}} MemorySwap={{.HostConfig.MemorySwap}}' "$CID"Values are in bytes. Interpretation rules depend on Docker version and whether swap is enabled on the host—when in doubt, reproduce on the same OS/Docker pair and confirm with cgroup files.
Inside the container: /proc/meminfo, free, top
Many containers show MemTotal in /proc/meminfo that reflects host memory, not your cgroup limit. That does not mean cgroups are broken; it means /proc is not a reliable “container RAM size” API unless your environment uses a cgroup-aware filesystem layer (some platforms do, many defaults do not).
Demonstrate quickly:
docker run --rm -m 256m alpine:3.20 sh -lc 'grep ^MemTotal: /proc/meminfo; echo "---"; free -m'You will commonly see MemTotal far larger than 256m. Yet the cgroup limit still applies.
What to do instead (engineering workflow):
- From the host, read the cgroup
memory.max/memory.current(v2) or v1 equivalents. - From inside the container, treat
topas per-process tooling, not “billing.”
Example: show cgroup v2 files from inside if mounted read-only (depends on runtime setup):
docker run --rm -m 256m alpine:3.20 sh -lc 'ls -1 /sys/fs/cgroup 2>/dev/null | head'If you do not see usable memory files inside, that is normal—your authoritative reads may remain host-side.
Kubernetes: requests, limits, eviction, and OOM
Kubernetes YAML vs Docker / Compose (same cgroup cap). In a pod, memory is declared under spec.containers[].resources:
resources:
  requests:
    memory: "256Mi"   # used heavily for scheduling; not the cgroup hard cap
  limits:
    memory: "512Mi"   # what the runtime usually maps to the cgroup memory cap
Rough correlation for readers who know Docker but are new to Kubernetes:
| Kubernetes field | Role | Typical Docker / Compose analogue |
|---|---|---|
resources.limits.memory |
Hard cgroup-style cap (OOM when exceeded) | docker run --memory / --memory (-m); Compose mem_limit |
resources.requests.memory |
Scheduler input (“this pod needs about this much”); not a kernel hard cap by itself | No exact docker run equivalent. Closest optional knob is --memory-reservation (soft reservation on the same container). Swarm / Compose deploy: resources.reservations.memory; Compose (non-swarm): mem_reservation |
Examples (same 512Mi cap):
# Docker CLI: cap only (compare to resources.limits.memory)
docker run --rm -m 512m alpine:3.20 true# docker-compose (service-level, classic fields)
services:
app:
image: alpine:3.20
mem_limit: 512m
mem_reservation: 256m # optional; compare loosely to resources.requests.memory# Kubernetes: requests + limits together (what you see in real manifests)
apiVersion: v1
kind: Pod
metadata:
name: demo
spec:
containers:
- name: app
image: alpine:3.20
resources:
requests:
memory: "256Mi"
limits:
memory: "512Mi"Important nuance: a Kubernetes request affects which node can fit the pod and QoS class; it does not replace a limit. A pod with only requests.memory and no limits.memory is valid (Burstable / BestEffort patterns), but then there may be no cgroup memory cap unless something else sets one—behavior depends on your cluster defaults and policies.
Keep scheduling, cgroup caps, and node-level policy in separate mental buckets:
- Requests primarily affect scheduling (where the pod can land, bin-packing assumptions).
- Limits are what the kubelet/runtime typically maps into cgroup caps for the workload.
- Kubernetes assigns a QoS class (Guaranteed / Burstable / BestEffort) from how you set CPU and memory requests and limits. Under node pressure, QoS influences which pods get throttled or evicted first. That is not the same thing as cgroup OOM on a memory limit, but it matters when the node is unhealthy.
Eviction and OOMKilled are different mechanisms. Eviction is kubelet and node-level pressure; OOMKilled is usually cgroup limit enforcement on the container.
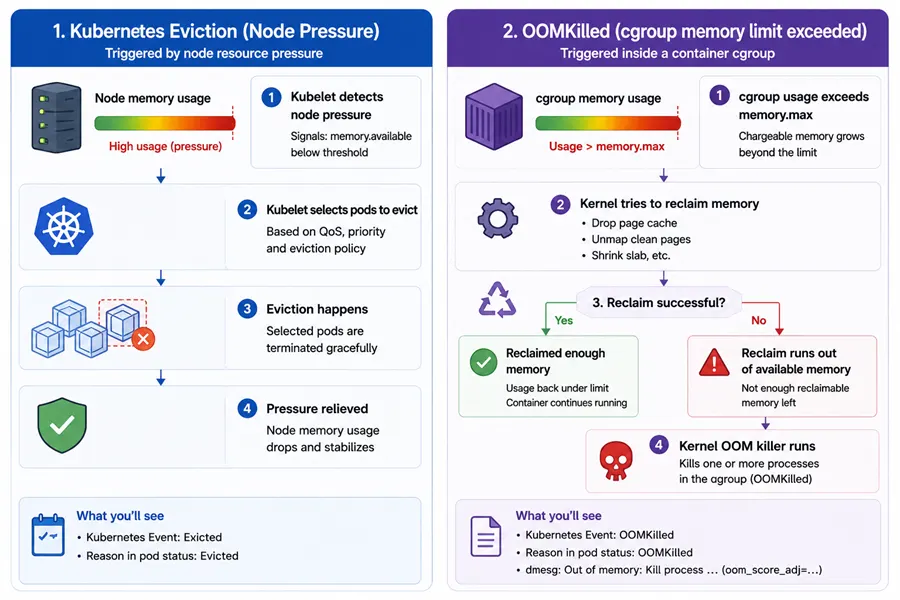
- Eviction: kubelet tries to free node-level resources and may terminate pods before the kernel cgroup OOM path triggers, depending on signals and thresholds.
OOMKilled: commonly indicates the cgroup memory controller killed a container process because cgroup usage exceeded the memory limit (or related constraints on your kernel/runtime).
When you write an incident note, separate:
- kubelet events about eviction / node pressure
OOMKilledon the container statusdmesg/ kernel logs around the same timestamp
Exact cgroup paths differ by Kubernetes distribution, cgroup driver, and systemd layout. A robust operational approach is: get the pod UID, then locate cgroup directories containing that UID on the node.
NS=default
POD=my-pod
UID="$(kubectl -n "$NS" get pod "$POD" -o jsonpath='{.metadata.uid}')"
echo "pod uid=$UID"

# On the node that runs the pod:
sudo find /sys/fs/cgroup -maxdepth 6 -type d -name "*${UID}*" 2>/dev/null | head
Then inspect memory.max, memory.current, memory.stat, and memory.events under the leaf cgroup for your container.
kubectl top pod shows metrics from the Metrics API (served by metrics-server in many clusters). Those metrics are not a byte-for-byte duplicate of summed top RES inside a container, every field in memory.stat, or docker stats on a node. They can still be useful for trends and relative comparisons, but they are a poor sole source for deep cgroup disputes. Compare “API vs cgroup” honestly: note scrape lag, read cgroup files in the same wall-clock window, and if they differ explain different definitions and sampling—not “one tool is lying.”
OOM in containers: what to collect in five minutes
Reclaimable memory and “high metrics, low RSS”. cgroup usage totals (v1 memory.usage_in_bytes, v2 memory.current) include more than anonymous heap: page cache, slab, buffers, and other file-backed or kernel structures can sit in the same counter. Dashboards or agents that surface only that total can look alarming while per-process RSS in top stays modest. For triage, always open memory.stat and compare at least rss, cache, inactive_file (v1 names; v2 uses anon / file and related keys) and slab where present. A large gap between total usage and rss often means reclaimable cache/slab is in play—not necessarily a leak.
Once cgroup limits and reclaimable memory are ruled in or out as the story, classic application leak hunting still uses host-oriented profilers and tracers; for that toolkit angle, see tools to detect memory leaks in Linux.
The kernel can reclaim much of that cache under pressure so anonymous allocations (your application heap) can still grow without immediately hitting OOMKilled, as long as the overall cgroup stays under the hard limit and reclaim keeps up. When the workload frees anonymous memory, total cgroup usage can drop sharply again. That behavior is normal; it does not contradict the limit model.
For background on how cache shows up in free and why “used” memory can look high when most of it is reclaimable cache, see Red Hat’s discussion: What is cache in free -m output and why is memory utilization high for cache?. For cgroup accounting changes and why memory.usage_in_bytes / kmem-related fields can shift between minor OS releases (which affects how you compare hosts), see: memory.usage_in_bytes and memory.kmem.usage_in_bytes on RHEL 8.3 vs 8.4.
When a container exits with OOMKilled, collect:
- Kubernetes description and events
kubectl -n default describe pod my-pod- Container exit details
kubectl -n default get pod my-pod -o jsonpath='{.status.containerStatuses[0].lastState.terminated}{"\n"}' | jq .- cgroup evidence (v2 example)
# On the node, after you locate the cgroup directory:
grep . /sys/fs/cgroup/<path>/memory.events
cat /sys/fs/cgroup/<path>/memory.max
cat /sys/fs/cgroup/<path>/memory.current
grep -E '^(anon|file|slab)\b' /sys/fs/cgroup/<path>/memory.stat- cgroup evidence (v1 example)
CG=/sys/fs/cgroup/memory/<your-container-cgroup>
grep -E '^(rss|cache|inactive_file|slab)\b' "$CG/memory.stat"
cat "$CG/memory.usage_in_bytes"
cat "$CG/memory.limit_in_bytes"- Kernel ring buffer (host)
sudo dmesg -T | tail -n 200If you see cgroup OOM killer messages around the same time as OOMKilled, that is strong alignment.
cgroup v2: memory.high vs memory.max. If memory.high is set below memory.max, your workload can experience throttling and reclaim pressure before hitting the hard cap. For triage, always read both:
# Run these from inside the container cgroup directory on the host:
echo -n "memory.high: "; cat memory.high
echo -n "memory.max: "; cat memory.max
Quick reference: what to open for which question
| Question | cgroup v2 | cgroup v1 | Notes |
|---|---|---|---|
| What is the cap? | memory.max |
memory.limit_in_bytes |
max / huge value means “no cap” |
| What is usage now? | memory.current |
memory.usage_in_bytes |
pair with memory.stat |
| Why did usage grow? | memory.stat (anon, file, …) |
memory.stat |
correlate with workload |
| Did cgroup OOM happen? | memory.events |
depends on setup/logs | also check dmesg |
| Per-process truth | /proc/<pid>/status, smaps_rollup |
same | namespace-aware PID |
Related reading
- Linux memory management overview (virtual vs resident memory, page cache basics, general OOM introduction)
- How to check memory usage per process in Linux (
ps/top,/proc/<pid>/status,smaps_rollup, RSS vs PSS—use alongside cgroup files in containers) - How to limit CPU using cgroups on Linux (same cgroup machinery for the CPU controller; useful when you are already on the host reading
cpu.max/ quota files next to memory) - Tools to detect memory leaks in Linux (Valgrind, core dumps, and related tooling—after you separate cgroup caps from heap growth)
- Red Hat Knowledgebase — What is cache in
free -moutput and why is memory utilization high for cache? (page cache vs “used” memory infree) - Red Hat Knowledgebase —
memory.usage_in_bytesandmemory.kmem.usage_in_byteson RHEL 8.3 vs 8.4 (cgroup v1 accounting can shift between minor releases; useful when totals disagree across OS versions)