
There are many ways to Node.JS monitor HTTP(s) traffic. You can code the application from scratch or use HTTP debugging tools like mitmproxy and fiddler.
This tutorial teaches you how to monitor Node.js traffic without installing or subscribing to third-party software.
First, it would be best to understand the role of the http or https
module in measuring Node.JS traffic. Next, you should familiarize
yourself with the response headers. Lastly, the tutorial walks you
through practical examples of Node.JS monitor HTTP(s) traffic.
Let's get started.
The role of http(s) module in Node.js
HTTP(s) traffic is the data being transferred between a web server and a client over the HTTP(s) protocol.
Node.JS monitor HTTP(s) traffic happens through instrumentation; examining the origin of events in your code. You hook up every request to capture elements like request headers, status codes, and the actual data being sent.
Node.js simplifies instrumentation through the http or https module.
The http module mainly transfers data in the form of text. As a
result, the method is less secure than the https module, which
encrypts the data.
Typical data to expect when monitoring HTTP(s) traffic
Apart from the requested data, you can inspect the status codes and HTTP (response) headers.
Status codes are grouped into 100s, 200s, 300s, 400s, and 500s. HTTP status codes below 200 are informational; 200 to 299, successful response; 300 to 399, redirection; 400 to 499, client errors; 500 to 599 result from server errors.
For example, an HTTP status code of 200 means the request was successful, and you get an OK message. On the other hand, a 304 status code notifies the client that the data has not been modified, and they can continue using the cached response version.
HTTP headers are additional information you can pass with the request or response. For example, you could receive content type, date, connection, and expiry duration headers when you request a resource from an external API.
Let's set up a lab and log some of the header information.
Lab setup environment
In this section, we will set up a lab to practice monitoring Node.js traffic when making a request to the jsonplaceholder.typicode.com/users endpoint.
Launch the terminal, make the project directory, and cd into it.
mkdir nodeTraffic && cd nodeTrafficNext, create the script file using a code editor of your choice. I am using Vim on Ubuntu 22.04. You should have installed Node.js before that.
vim main.js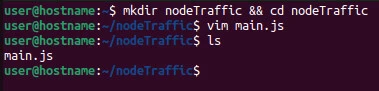
Now we can monitor the traffic from the API.
Node.js monitor HTTP(s) traffic [Step-by-Step]
Step~1: Import the http(s) module
We will use the https module to make the request because most remote
websites prefer HTTPS to HTTP connection when connecting to a client.
The module comes with native Node.js libraries, so you don't install it
with NPM.
const https = require("https")Step~2: Specify the options
Let's store the request options in an object before using them in step~3 of this tutorial.
const options = {
    hostname: "jsonplaceholder.typicode.com",
    port: 443,
    path: "/users",
    method: "GET"
}
The hostname holds the (string) URL to the remote resource. Don't
include the request method in the URL because doing so will interfere
with the response. For example, use hostname:
"jsonplaceholder.typicode.com" instead of
https://jsonplaceholder.typicode.com.
The port tells us whether we are using HTTP or HTTPS protocol. For
instance, port 80 handles HTTP traffic, while port 433 handles HTTPS
traffic.
The path shows the target endpoint. For example, we are targeting
users on the /users endpoint.
Lastly, we specify the HTTP method. For example, we are GETTING the
resource, not POSTING it to a resource or making a DELETE request.
Step~3: Monitor the traffic
Using the https module's request() method, let's ask for data from
the API and console-log the response.
const req = https.request(options, res => {
    console.log("statusCode: ", res.statusCode)
    console.log("headers: ", res.headers)
    res.on('data', data => console.log(data.toString()))
})
The request() method accepts the options and handles the response with
a callback function accepting the response object.
We can then inspect the status code and response headers by printing
them on the console output. Likewise, we can listen to the data using
the .on() method. Since the data comes in bytes, we convert it to
strings using the toString() method.
Step~4: End the request
We should catch errors that may arise from the request before closing the connection.
req.on("error", e => console.log(e))
req.end()
Using the .on() method, we catch and print any error thereq object
may generate. We then close the request using the .end() method.
Lastly, save the script file, return to the terminal and run the file
with the node command.
node main.jsHere is a summary of the input and output.
Input
const https = require("https")

const options = {
    hostname: "jsonplaceholder.typicode.com",
    port: 443,
    path: "/users",
    method: "GET"
}

const req = https.request(options, res => {

    console.log("statusCode: ", res.statusCode)
    console.log("headers: ", res.headers)
    res.on('data', data => console.log(data.toString()))
})

req.on("error", e => console.log(e))
req.end()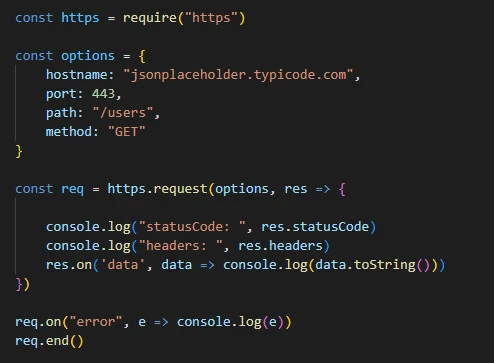
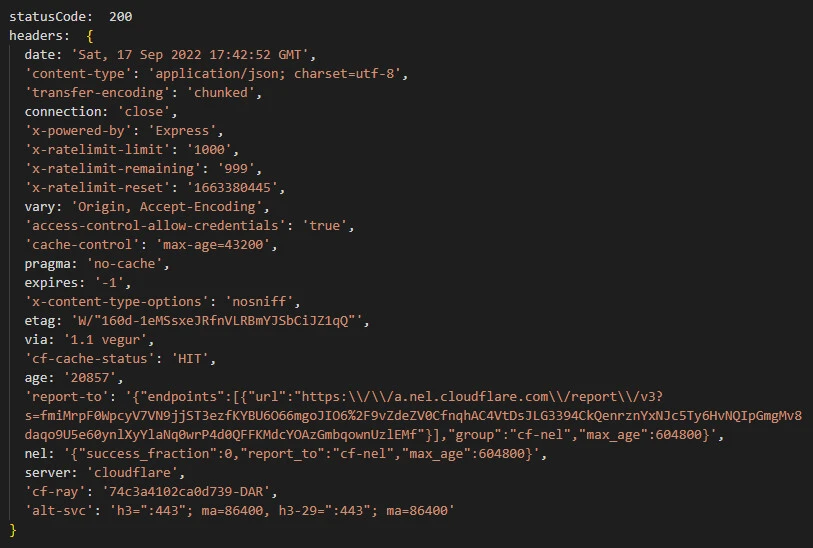
Output
Apart from the data, we get a status code of 200
statusCode: 200and the response headers with key-values paired data like date and
content-type.
headers:  {
  date: 'Mon, 12 Sep 2022 12:56:10 GMT',
  'content-type': 'application/json; charset=utf-8',
  'transfer-encoding': 'chunked',
  connection: 'close',
  'x-powered-by': 'Express',
  'x-ratelimit-limit': '1000',
  'x-ratelimit-remaining': '999',
  'x-ratelimit-reset': '1662917083',
  vary: 'Origin, Accept-Encoding',
  'access-control-allow-credentials': 'true',
  'cache-control': 'max-age=43200',
  pragma: 'no-cache',
  expires: '-1',
  'x-content-type-options': 'nosniff',
  etag: 'W/"160d-1eMSsxeJRfnVLRBmYJSbCiJZ1qQ"',
  via: '1.1 vegur',
  'cf-cache-status': 'HIT',
  age: '20624',
  'report-to': '{"endpoints":[{"url":"https:\\/\\/a.nel.cloudflare.com\\/report\\/v3?s=dTWLwI0uBxH2o4x15ltfpgbr2K3h1OBk0kL%2FF6NIPsWgX%2Fc7%2B8Xf3LvarxlhGwgeRuwYBQpqEsvXOUYHJJ5opW0JwE4bO%2B5Y4bSdpevFtSzqIWcB2DXW3w3e1K0%2BxOSOtHpviPj7ID5lDCXShD6v"}],"group":"cf-nel","max_age":604800}',
  nel: '{"success_fraction":0,"report_to":"cf-nel","max_age":604800}',
  server: 'cloudflare',
  'cf-ray': '7498cd38fa9fd73d-DAR',
  'alt-svc': 'h3=":443"; ma=86400, h3-29=":443"; ma=86400'
}
[
  {
    "id": 1,
    "name": "Leanne Graham",
    "username": "Bret",
    "email": "[email protected]",
    "address": {
      "street": "Kulas Light",
      "suite": "Apt. 556",
      "city": "Gwenborough",
      "zipcode": "92998-3874",
      "geo": {
        "lat": "-37.3159",
        "lng": "81.1496"
      }
    },
    "phone": "1-770-736-8031 x56442",
    "website": "hildegard.org",
    "company":
{
      "name": "Romaguera-Crona",
      "catchPhrase": "Multi-layered client-server neural-net",
      "bs": "harness real-time e-markets"
    }
  },
  {
    "id": 2,
    "name": "Ervin Howell",
    "username": "Antonette",
    "email": "[email protected]",
    "address": {
      "street": "Victor Plains",
      "suite": "Suite 879",
      "city": "Wisokyburgh",
      "zipcode": "90566-7771",
      "geo": {
        "lat": "-43.9509",
        "lng": "-34.4618"
      }
    },
    "phone": "010-692-6593 x09125",
    "website": "anastasia.net",
    "company": {
      "name": "Deckow-Crist",
      "catchPhrase": "Proactive didactic contingency",
      "bs": "synergize scalable supply-chains"
    }
  },
...
Conclusion
In this tutorial, you learned to Node.JS monitor HTTP(s) traffic by inspecting the response status, headers, and other data.
Before that, the tutorial explained concepts like instrumentation, HTTP vs HTTPS, and when to apply their respective Node.js modules. The tutorial then walked you through an overview of the expected traffic and how to monitor it practically.
Now that you understand how to monitor the traffic, you should comfortably use third-party HTTP debugging tools to simplify the process.
Further Reading
how
to monitor the network on node.js similar to chrome/firefox developer
tools?
listening https traffic in
nodejs