When you troubleshoot slow applications, high load, throttling, or uneven process speed, CPU terms start to matter. CPU, processor, socket, core, thread, logical CPU, hyper-threading, cache, and frequency are related, but they are not the same thing.
The simplest way to separate them is to start from the physical hardware and then move toward what Linux schedules:
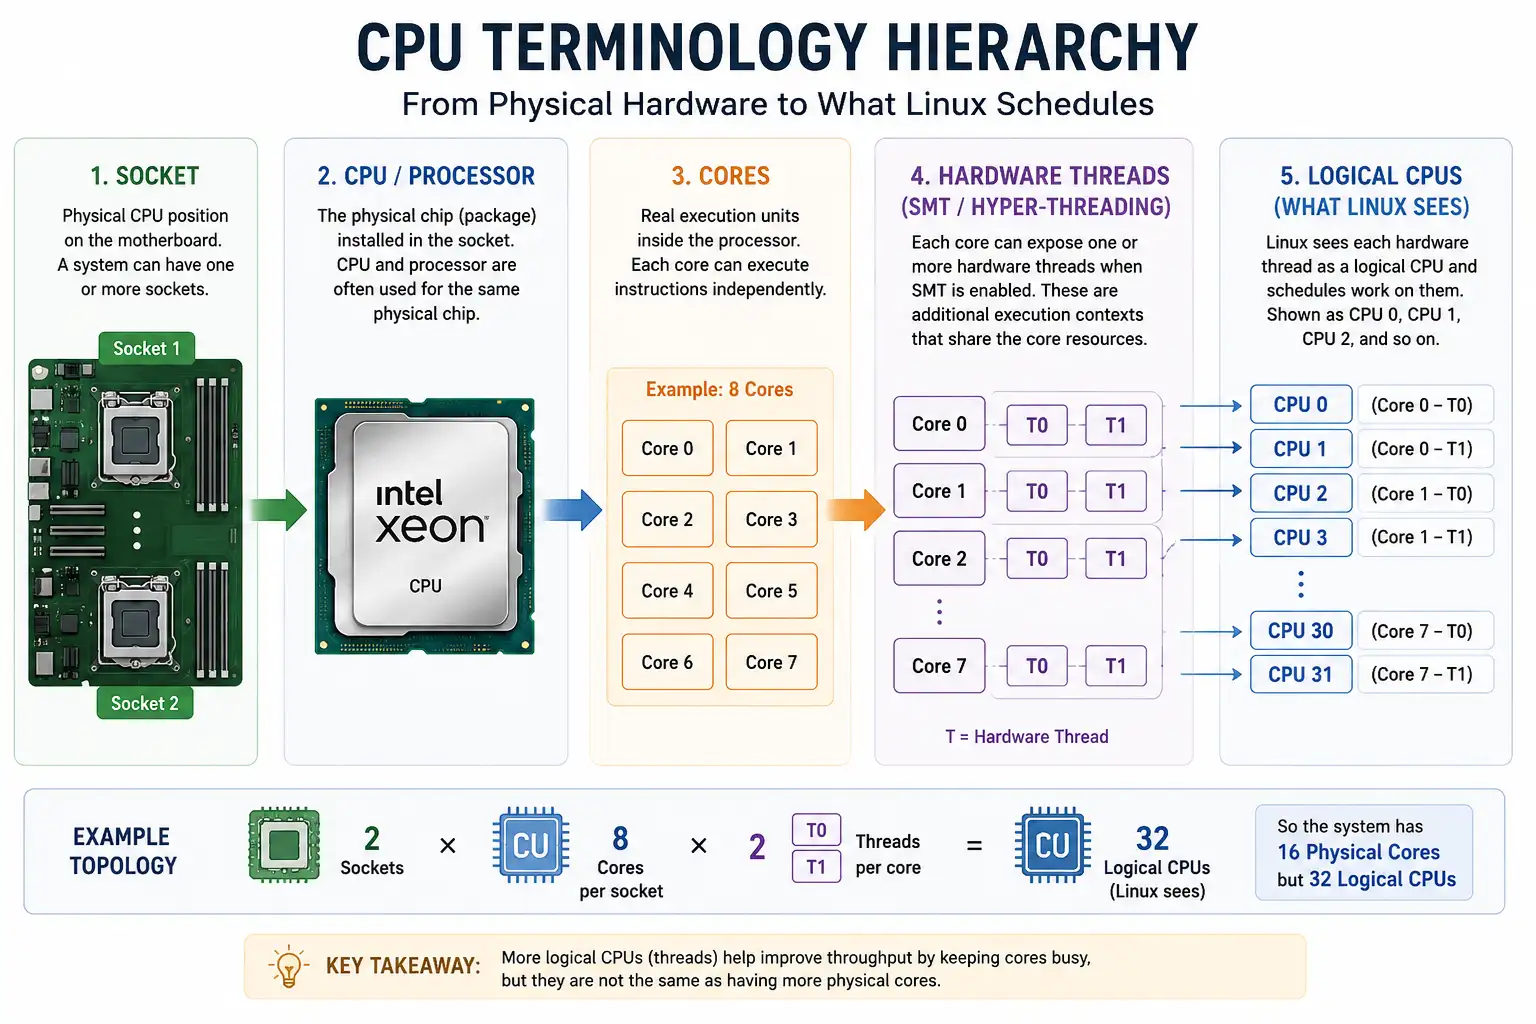
- A socket is the physical CPU position on the motherboard. A laptop usually has one socket. A server may have two or more.
- A CPU or processor is the chip/package installed in that socket. In normal conversation, CPU and processor often mean the same physical chip.
- A core is a real execution unit inside the processor. If a processor has 8 cores, it can run up to 8 CPU-bound tasks truly in parallel before SMT is considered.
- A hardware thread is an extra execution context exposed by a core when SMT or Hyper-Threading is enabled. It helps keep the core busy, but it is not another full physical core.
- A logical CPU is what Linux can schedule work on. Linux shows these as CPU 0, CPU 1, CPU 2, and so on.
- A software thread is created by an application. Linux schedules runnable software threads onto logical CPUs.
For example, a system with 2 sockets x 8 cores per socket x 2 threads per core has 32 logical CPUs. Linux can schedule 32 runnable tasks at the same instant, but the system still has only 16 physical cores. This is why 16 cores / 32 threads is not the same as 32 cores.
For live CPU usage commands, see how to check CPU utilization in Linux. For process discovery before checking a PID, see how to list running processes in Linux. For per-process thread inspection, see how to check thread count per process in Linux.
Quick Commands
| Goal | Command |
|---|---|
| Show CPU model, sockets, cores, threads and caches | lscpu |
| Count logical CPUs | nproc --all |
| Show CPU, core, socket and NUMA mapping | lscpu -e=CPU,CORE,SOCKET,NODE,ONLINE,MAXMHZ,MINMHZ,MHZ |
| Show cache layout | lscpu -C |
| Check SMT status | cat /sys/devices/system/cpu/smt/active |
| Check SMT control mode | cat /sys/devices/system/cpu/smt/control |
| Sample per-CPU utilization | mpstat -P ALL 1 2 |
| Check run queue, idle, I/O wait and steal time | vmstat 1 2 |
| Compare load average to logical CPU count | nproc --all; cat /proc/loadavg |
| Check CPU frequency driver/policy | cpupower frequency-info |
| Check whether Linux sees a hypervisor | Look for Hypervisor vendor in lscpu |
If lscpu reports a hypervisor and you need to confirm the platform type, see how to check if a Linux server is physical or virtual.
CPU Terms Mapped with Linux Output
The easiest way to understand CPU terminology is to read the fields from lscpu together instead of memorizing each word separately.
Here is one server output:
lscpuArchitecture: x86_64
CPU op-mode(s): 32-bit, 64-bit
Byte Order: Little Endian
CPU(s): 32
On-line CPU(s) list: 0-31
Thread(s) per core: 2
Core(s) per socket: 8
Socket(s): 2
NUMA node(s): 1
Vendor ID: GenuineIntel
CPU family: 6
Model: 63
Model name: Intel(R) Xeon(R) CPU E5-2640 v3 @ 2.60GHz
Stepping: 2
CPU MHz: 2600.000
CPU max MHz: 2600.0000
CPU min MHz: 1200.0000Read the important fields like this:
lscpu field |
Plain meaning | Value in this output |
|---|---|---|
Socket(s) |
Number of processor packages installed or exposed to Linux | 2 sockets |
Core(s) per socket |
Number of physical cores inside each processor package | 8 cores per socket |
Thread(s) per core |
Number of hardware threads exposed by each physical core | 2 threads per core |
CPU(s) |
Number of logical CPUs Linux can schedule work on | 32 logical CPUs |
On-line CPU(s) list |
Logical CPU IDs currently available | 0-31 |
Model name |
Processor model reported by the system | Intel Xeon E5-2640 v3 |
CPU MHz |
Current reported frequency at the time of collection | 2600.000 MHz |
CPU max MHz / CPU min MHz |
Reported frequency range | 2600.0000 / 1200.0000 MHz |
NUMA node(s) |
Number of memory locality groups visible to Linux | 1 NUMA node |
The logical CPU calculation is:
Logical CPUs = Socket(s) x Core(s) per socket x Thread(s) per core
Logical CPUs = 2 x 8 x 2 = 32
This matches both fields below:
CPU(s):                32
On-line CPU(s) list:   0-31
It also matches nproc:
nproc --all32So this system has:
- 2 processor sockets
- 16 physical cores in total:
2 sockets x 8 cores - 32 logical CPUs in total:
16 physical cores x 2 hardware threads per core - Hyper-Threading / SMT enabled, because each core exposes
2hardware threads
CPU, Processor and Socket
In normal conversation, CPU and processor often mean the same thing: the physical chip that executes instructions. In Linux command output, the word CPU can also mean a logical CPU number, such as CPU 0 or CPU 1.
That is the main source of confusion:
- In hardware discussions, "one CPU" may mean one physical processor package.
- In Linux tools, "CPU 0" usually means one schedulable logical CPU.
- In server documentation, "socket" usually means one physical processor position/package.
In the sample output:
Socket(s):             2
Model name:            Intel(R) Xeon(R) CPU E5-2640 v3 @ 2.60GHz
This means Linux sees two processor packages of that CPU model.
You can also see the two physical processor positions from dmidecode:
dmidecode -t 4 | grep -E 'Socket Designation|Count' Socket Designation: Proc 1
Core Count: 8
Thread Count: 16
Socket Designation: Proc 2
Core Count: 8
Thread Count: 16Each socket has 8 cores and 16 hardware threads. Across both sockets, that becomes 16 physical cores and 32 hardware threads/logical CPUs.
CPU Core
A core is a real execution unit inside a processor. A core has the hardware needed to execute instructions. More physical cores allow more work to run truly in parallel.
In the sample output:
Core(s) per socket:    8
Socket(s):             2
So the physical core count is:
Physical cores = 2 sockets x 8 cores per socket = 16 physical coresThis command shows the core IDs visible inside one processor package:
grep 'core id' /proc/cpuinfo | sort -ucore id : 0
core id : 1
core id : 2
core id : 3
core id : 4
core id : 5
core id : 6
core id : 7The unique core IDs are 0 through 7, which confirms 8 core IDs per socket. On a multi-socket system, the same core IDs can appear under more than one physical socket, so use Socket(s) and Core(s) per socket together when calculating the total physical cores.
More cores do not automatically make one single process faster. They help most when the workload can split work across multiple runnable threads or processes.
Thread
The word thread has two meanings, and you must separate them.
| Thread type | Plain meaning | Where you see it |
|---|---|---|
| Software thread | A thread created by an application or runtime | ps -T, top -H, application metrics |
| Hardware thread | An execution context exposed by a CPU core | Thread(s) per core, logical CPU count |
A Java process may have 200 software threads. That does not mean the system has 200 CPU cores. It means Linux has 200 schedulable tasks from that process. If the system has 32 logical CPUs, only 32 CPU-bound threads can run at the same instant; the rest wait, sleep, block on I/O, or wait for locks.
Useful process-thread checks:
ps -o pid,nlwp,comm -p <PID>
ps -T -p <PID> -o pid,spid,psr,stat,comm
top -H -p <PID>
For detailed examples, see how to check thread count per process in Linux. If you are still finding the right PID or process name, start with practical ps examples for listing running processes.
Logical CPU
A logical CPU is what Linux schedules work on. In Linux tools, logical CPUs are usually numbered as 0, 1, 2, and so on.
In the sample output:
CPU(s):                32
On-line CPU(s) list:   0-31
This means Linux has 32 schedulable CPU IDs: CPU 0 through CPU 31.
The mapping is:
2 sockets x 8 cores per socket x 2 threads per core = 32 logical CPUsWithout SMT/Hyper-Threading, 16 physical cores would normally expose 16 logical CPUs. With Thread(s) per core: 2, each physical core exposes two logical CPUs, so Linux sees 32.
Hyper-Threading and SMT
Hyper-Threading is Intel's name for simultaneous multithreading. AMD commonly uses the term SMT. Both refer to a physical core exposing more than one hardware thread to the operating system.
In this output, SMT/Hyper-Threading is visible here:
Thread(s) per core: 2That does not mean each core became two full cores. It means each physical core exposes two logical CPUs. The sibling logical CPUs share many internal core resources.
This is why the sample system should be understood as:
16 physical cores / 32 logical CPUsnot:
32 physical coresSMT can improve throughput when one thread is waiting on memory, cache, branch prediction, or another dependency. But two busy CPU-bound threads on sibling logical CPUs can also compete with each other, so the gain depends on the workload.
Common SMT status checks:
cat /sys/devices/system/cpu/smt/active
cat /sys/devices/system/cpu/smt/control
Common output meaning:
| Output | Meaning |
|---|---|
active = 1 |
SMT is active |
active = 0 |
SMT is not active |
control = on |
SMT is enabled |
control = off |
SMT is disabled |
control = forceoff |
SMT was force-disabled and usually cannot be re-enabled without reboot |
control = notsupported |
Current CPU topology does not expose SMT support |
CPU Cache Explained
CPU cache is small, fast memory close to the processor. It exists because RAM is much slower than the CPU core. If the core had to wait on RAM for every instruction or data access, the CPU would waste a lot of cycles.
| Cache | Typical role | Troubleshooting meaning |
|---|---|---|
| L1 data cache | Very small and very fast data cache close to each core | Best for frequently used data |
| L1 instruction cache | Very small and very fast instruction cache | Helps repeated code paths execute quickly |
| L2 cache | Larger, slightly slower cache, commonly per core | Helps when data does not fit in L1 |
| L3 cache | Larger last-level cache, often shared by cores | Helps communication and shared working sets across cores |
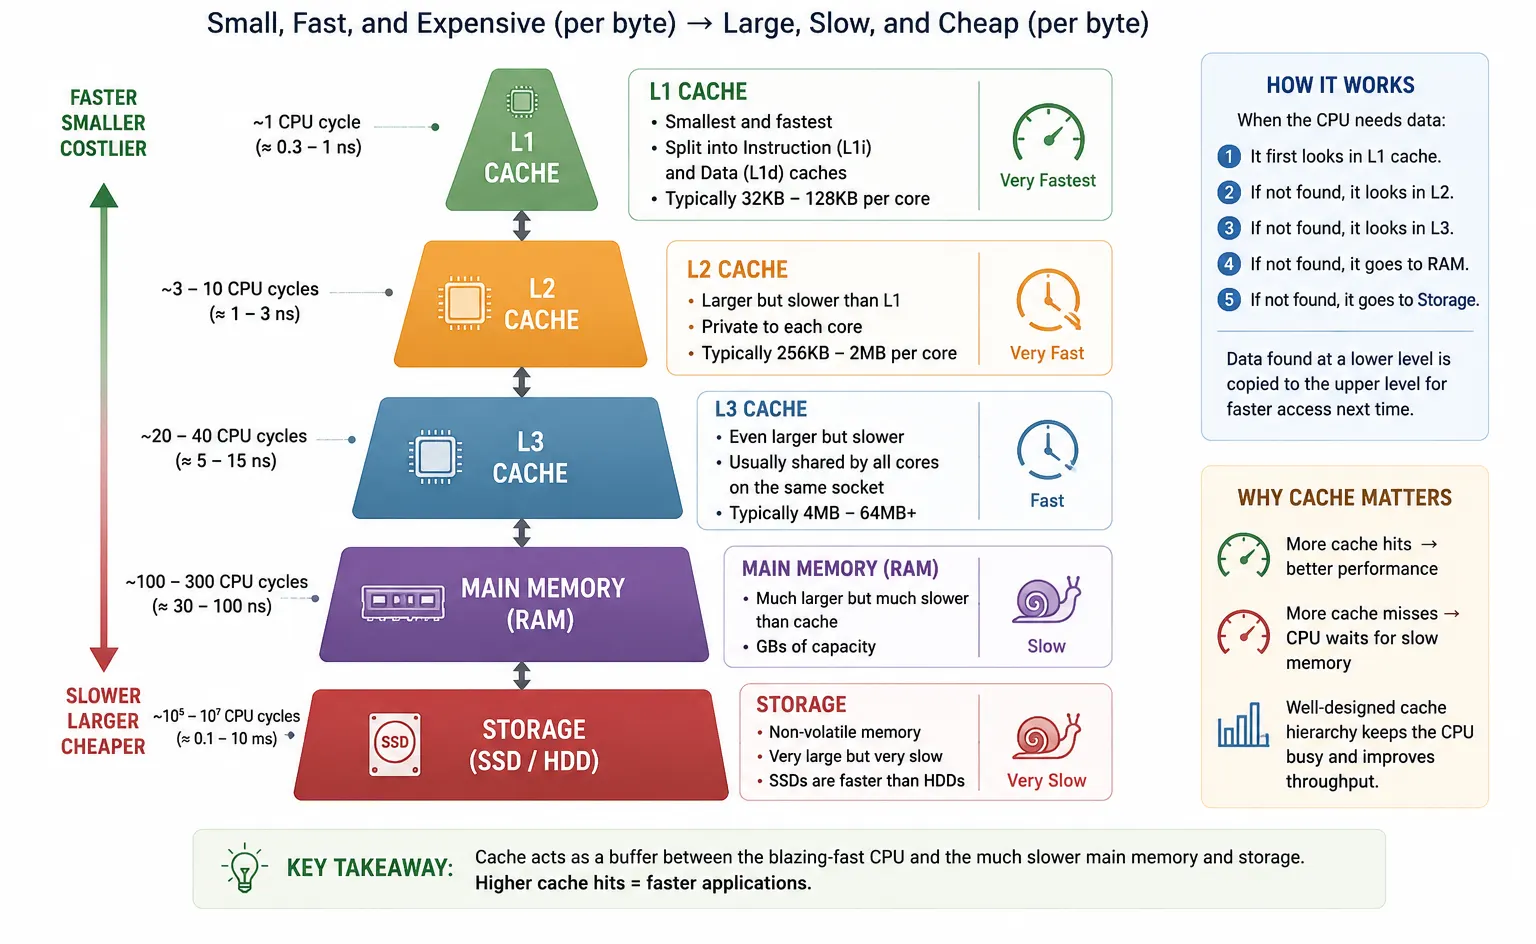
Cache keeps frequently used instructions and data close to the CPU core. L1 is the smallest and fastest cache, L2 is larger but slightly slower, L3 is usually larger again and often shared by multiple cores, and RAM is much larger but slower to access. If the needed data is already in cache, the core can continue quickly. If it must fetch data from RAM, execution can slow down.
A cache line is the block of memory moved into cache at one time, commonly 64 bytes on x86 systems. This is why contiguous arrays usually behave better than pointer-heavy structures scattered across memory, and why false sharing hurts when multiple threads update different values that sit on the same cache line.
Cache behavior matters when:
- A process is CPU-bound but still slower than expected.
- Performance changes when the process moves between CPUs.
- Many threads update data located on the same cache line.
- A workload has a large working set and frequent cache misses.
- NUMA or socket locality causes remote memory access.
For deeper program-level cache profiling, tools such as perf and Valgrind Cachegrind can help, but those should be used against the specific application you are debugging. For the memory side of the same problem, see Linux memory management basics and how to check memory usage per process.
NUMA and Memory Locality
NUMA means Non-Uniform Memory Access. On larger multi-socket servers, each processor socket may have memory attached closest to that socket. A core can access local memory faster than memory attached to another socket.
In a NUMA system, memory attached to the same socket is usually faster for that socket's cores. Accessing memory attached to another socket still works, but it can take longer.
Use lscpu for the first check:
lscpu | grep -i numaThe sample server output reports one NUMA node:
NUMA node(s): 1With one NUMA node, there is no near-versus-far memory placement to tune. On a two-socket or four-socket server, you may see multiple NUMA nodes, and then numactl --hardware, CPU affinity, and application worker placement become more important. For memory-heavy workloads, also compare this with Linux memory management basics.
CPU Frequency, Turbo and Throttling
CPU frequency is the speed at which the processor is currently operating. Modern CPUs do not always run at one fixed speed. They change frequency to balance performance, power and temperature.
On Linux, CPU frequency scaling is handled through the kernel CPUFreq subsystem when the platform exposes it. The important pieces are:
- A scaling driver, such as
intel_pstate,amd-pstateoracpi-cpufreq - A governor or hardware-managed policy
- Minimum and maximum allowed frequencies
- Boost or turbo behavior
- Thermal and power limits
When debugging throttling on physical hardware, compare:
- Expected CPU max frequency from
lscpu - Current frequency from
cpupower frequency-info - Temperature readings from platform tools
- Kernel logs for thermal, power or firmware limits
- Workload behavior before and after cooling, power-plan, BIOS or governor changes
For OS-level performance profiles, see how to create a custom tuned profile in Linux. Tuned does not replace hardware cooling or firmware limits, but it is useful when governor and performance-policy settings are part of the investigation.
How These Terms Help Debug Performance
| Symptom | Likely CPU concept involved | What to check |
|---|---|---|
| One process is slow but total CPU usage is low | Single-thread bottleneck | top, mpstat -P ALL, application thread model |
| Load average is high | Runnable tasks waiting for CPU, or tasks stuck in uninterruptible I/O wait | uptime, top, vmstat 1, mpstat -P ALL 1 |
| One CPU is 100% and others are idle | Per-core imbalance or CPU affinity | mpstat -P ALL, taskset -pc <PID>, application worker settings |
| More threads do not improve speed | Lock contention, I/O wait, memory bottleneck or SMT sharing | ps -T, top -H, application metrics |
| Performance drops after a few minutes | Thermal or power throttling | cpupower frequency-info, temperature tools, kernel logs |
| VM performance is inconsistent | Host contention or hypervisor scheduling | %steal in mpstat or vmstat, cloud/provider metrics |
| CPU-bound job slows when pinned to sibling CPUs | SMT sibling contention | CPU topology, thread_siblings_list, affinity settings |
| Memory-heavy job is slow on multi-socket server | NUMA locality and cache locality | lscpu, numactl --hardware, process placement |
For CPU usage commands and examples, see how to check CPU usage in Linux. If high load is mostly I/O wait, compare it with disk I/O performance monitoring tools. For cgroup limits, see limit CPU usage with cgroups in Linux.
Common Beginner Questions
Are CPU cores and threads the same?
No. A core is physical execution hardware inside the processor. A thread can mean either a software thread created by an application, or a hardware thread exposed by SMT/Hyper-Threading.
In Linux troubleshooting, this difference matters because tools mix these terms. Thread(s) per core in lscpu refers to hardware threads. ps -T, top -H and application thread counts refer to software threads. A process can have hundreds of software threads even when the machine has only 8 or 16 physical cores.
Use this rule:
- Core = real CPU execution unit
- Hardware thread / logical CPU = schedulable CPU created from that core
- Software thread = work created by a process and scheduled by Linux
Is 8 cores and 16 threads twice as fast as 8 cores and 8 threads?
Usually no. An 8-core / 16-thread processor still has 8 physical cores. The extra 8 hardware threads come from SMT/Hyper-Threading, so each pair of sibling logical CPUs shares the same physical core.
SMT can improve total throughput when one thread is waiting on memory, cache, branch prediction, I/O, or another dependency. It is less helpful when all threads are already doing heavy CPU execution at the same time. In that case, sibling logical CPUs compete for shared core resources.
Practical way to read it:
- 8 cores / 8 threads = 8 physical cores without SMT exposed
- 8 cores / 16 threads = 8 physical cores with 2 hardware threads per core
- Expect some extra throughput from SMT, not a guaranteed 2x speedup
Why does Linux show fewer CPUs than my processor specification?
First check what Linux is actually seeing:
lscpu
nproc --all
Then compare Socket(s), Core(s) per socket, Thread(s) per core and CPU(s). If the processor specification says 16 threads but Linux shows 8 CPUs, common causes are SMT disabled in BIOS/firmware, kernel boot options limiting CPUs, offline CPUs, or a virtual machine exposing only part of the host CPU.
In containers and cloud servers, this is especially common. The physical host may have many cores, but your VM or container only receives the vCPUs assigned by the provider, instance size, cgroup limit, or orchestration platform. Always trust the topology visible to the running Linux system when debugging that system. If you are unsure whether the server is bare metal or virtualized, use these commands to check if a server is physical or virtual.
Why does CPU usage show 300% for one process?
Many Linux tools count CPU usage per logical CPU. That means 100% usually means one logical CPU is fully busy, not the whole machine.
For example, on a 4-logical-CPU system:
100% = one logical CPU busy
300% = about three logical CPUs busy
400% = all four logical CPUs busy
This normally means the process is multithreaded or has multiple runnable tasks. Use top -H -p <PID> or ps -T -p <PID> to see which process threads are consuming CPU, and use mpstat -P ALL 1 to confirm whether the load is spread across CPUs or concentrated on only a few. For a full walkthrough, see how to check thread count per process in Linux.
Does CPU cache make a process faster?
Yes, but only when the workload can benefit from it. CPU cache helps when a process repeatedly uses the same instructions or data and that working set fits close to the CPU. In that case, the core spends less time waiting for slower RAM.
Cache is not a manual "speed boost" you enable for a process. It is a hardware behavior affected by the program's memory access pattern. Contiguous data, repeated access and good locality usually perform better. Large random memory access, pointer-heavy data structures and false sharing between threads can reduce performance even when CPU usage looks high.
When a CPU-bound program is slower than expected, cache behavior is one possible reason. It becomes more relevant when performance changes after changing thread count, CPU affinity, data size, NUMA placement, or application data structures.
Should I disable hyper-threading?
For most general-purpose Linux servers, leave Hyper-Threading/SMT enabled unless you have a measured reason to disable it. It often improves throughput by letting the CPU do useful work while one hardware thread is stalled.
Disabling SMT can make sense for specific cases: strict latency tuning, certain security policies, software licensing models based on visible CPUs, or workloads where sibling logical CPUs cause measurable contention. It can also simplify CPU pinning because each schedulable CPU maps more directly to a physical core.
The practical answer is to test with your own workload. Compare throughput, latency, CPU utilization, run queue, and application response time with SMT on and off. Also check whether process or user limits are affecting the test; ulimit in Linux is a good starting point for shell-level resource limits. Do not assume SMT is always good or always bad based only on the logical CPU count.
Why are 16 physical cores not the same as 32 cores?
Consider a server with:
- 16 physical cores
- 2 hardware threads per core (SMT enabled)
Linux reports:
32 logical CPUsHowever, the system still has only:
16 physical execution coresWhen all physical cores are already fully busy, scheduling additional CPU-bound work onto SMT sibling threads usually provides a smaller gain than adding more physical cores.
Typical outcome:
- 16 physical cores -> strong parallel capacity for CPU-bound work
- 32 logical CPUs with SMT -> extra scheduling slots, but not 32 independent physical cores
This question makes sense because it is a common sizing mistake. A vendor, cloud dashboard, VM console, or Linux command may show 32 CPUs, but if those come from 16 cores x 2 threads per core, the machine has 16 physical execution cores. SMT helps keep execution units busy when one thread is stalled on memory, cache misses, branch prediction, or other delays. It should be viewed as a throughput enhancement rather than a replacement for additional physical cores.
When capacity planning, describe this system as 16 cores / 32 logical CPUs, not simply "32 cores". That wording prevents overestimating CPU-bound performance.
Frequently Asked Questions
1. What is the difference between CPU, processor, socket, core and thread?
CPU and processor are often used for the physical chip, socket is the motherboard slot or package position, core is a real execution unit inside the processor, and thread usually means either a software execution path or a hardware thread exposed as a logical CPU.2. How do I calculate logical CPUs in Linux?
In a simple layout, logical CPUs equal sockets multiplied by cores per socket multiplied by threads per core. lscpu shows these values as Socket(s), Core(s) per socket and Thread(s) per core.3. Is a hyper-thread the same as a physical core?
No. Hyper-threading or SMT exposes more than one logical CPU per physical core, but those logical CPUs share many core resources. It can improve throughput, but it is not the same as adding another physical core.4. Why can one CPU core be at 100 percent while total CPU usage looks low?
A single-threaded workload can saturate one logical CPU while other cores stay idle. Use top with per-CPU view or mpstat -P ALL to confirm per-core imbalance.5. What is CPU cache and why does it affect performance?
CPU cache is small, fast memory near the processor. L1 is fastest and smallest, L2 is larger, and L3 is usually shared across cores. Cache misses force the CPU to wait for slower memory and can reduce process speed.6. How do I check whether Linux is running on physical hardware or a virtual machine?
lscpu can show Hypervisor vendor and Virtualization type. If those fields are present, Linux is seeing a virtualized CPU instead of direct bare-metal CPU topology.Summary
CPU performance troubleshooting becomes easier when you separate the terms:
- Socket is the processor position/package.
- Core is real execution hardware.
- Hardware thread is an execution context exposed as a logical CPU.
- Software thread is created by an application and scheduled by Linux.
- Logical CPU is what Linux tools usually show as CPU 0, CPU 1, and so on.
- Cache keeps hot data near the CPU.
- Frequency scaling and throttling explain why the same process may run at different speeds over time.
Start with lscpu, nproc --all, lscpu -e, lscpu -C, mpstat -P ALL, and cpupower frequency-info. Then connect the output back to the actual symptom: single-thread bottleneck, too many runnable tasks, SMT contention, cache locality, VM steal time, or CPU frequency throttling.


![lscpu command examples in Linux [Cheat Sheet]](/lscpu-command-in-linux/lscpu_command_hu_6deff8393c5ca82a.webp)
![10+ vmstat command examples in Linux [Cheat Sheet]](/vmstat-command-in-linux/vmstat_command_hu_7d6ef68e8e4914a0.webp)
![20 sar command examples in Linux [Cheat Sheet]](/sar-command-in-linux/sar_command_hu_321b40c0856f8133.webp)
![20 top command examples in Linux [Cheat Sheet]](/top-command-in-linux/top_command_hu_6e01cde982a98535.webp)