
Grafana is the dashboard and alerting layer many teams pair with Prometheus, Loki, or InfluxDB. On Ubuntu the supported install path is the official Grafana Labs APT repository at apt.grafana.com—the same flow documented for Debian and Ubuntu on grafana.com.
This guide covers how to install Grafana on Ubuntu: add the signed repository, install the grafana OSS package (or a .deb when the repo metadata is ahead of your clock), start grafana-server, verify port 3000, and complete the first admin login. I ran these steps on Ubuntu 25.04; when apt update rejected the Grafana InRelease file, the .deb install path still worked and produced the same 13.0.2 build.
Tested on: Ubuntu 25.04 (Plucky Puffin); kernel 6.14.0-37-generic.
Quick command summary
| Task | Command |
|---|---|
| Add Grafana APT repo | See Step 1 below |
| Install OSS package | sudo apt install -y grafana |
| Enable and start | sudo systemctl enable --now grafana-server |
| Check service | systemctl is-active grafana-server |
| Verify HTTP | curl --noproxy '*' -sS http://127.0.0.1:3000/api/health |
| Open UI | http://YOUR_SERVER_IP:3000 (login admin / admin) |
Install specific .deb |
sudo apt install -y ./grafana_13.0.2_amd64.deb |
Prerequisites
- Ubuntu 22.04 LTS, 24.04 LTS, or newer (25.04 tested here).
- sudo and outbound HTTPS to
apt.grafana.comordl.grafana.com. - Port 3000 free on the host (
ss -tlnp | grep 3000should be empty before install). - For production, plan a reverse proxy with TLS; default Grafana serves HTTP on 3000.
To visualize metrics after install, you still need a data source (for example Prometheus). A companion article on this site covers setup Grafana with Prometheus on Rocky Linux—the data-source steps are the same once Grafana is running on Ubuntu.
Step 1: Add the official Grafana APT repository
Install prerequisites and import the current GPG key layout from Grafana docs:
sudo apt-get install -y apt-transport-https wget gnupg
sudo mkdir -p /etc/apt/keyrings
sudo wget -O /etc/apt/keyrings/grafana.asc https://apt.grafana.com/gpg-full.key
sudo chmod 644 /etc/apt/keyrings/grafana.asc
echo "deb [signed-by=/etc/apt/keyrings/grafana.asc] https://apt.grafana.com stable main" | sudo tee /etc/apt/sources.list.d/grafana.list
sudo apt-get update
For beta builds, replace stable with beta in the deb line.
If apt update says Release file is not valid yet
On my host at 03:12 IST, apt-get update failed with:
E: Release file for https://apt.grafana.com/dists/stable/InRelease is not valid yet (invalid for another 5h 53min 30s).That means the repository metadata’s Valid-From time was still in the future relative to the system clock (timedatectl showed System clock synchronized: no). Fixes:
- Enable NTP:
sudo timedatectl set-ntp true, wait a few minutes, retrysudo apt update. - Or install the current
.debfrom Grafana’s CDN (next section)—what I used to finish the test.
Step 2: Install Grafana OSS
From the repository:
sudo apt-get install -y grafanaEnterprise edition (optional):
sudo apt-get install -y grafana-enterpriseAlternative: install from a .deb package
When the APT repo is unreachable or clock-skewed, download the OSS package directly:
cd /tmp
wget https://dl.grafana.com/oss/release/grafana_13.0.2_amd64.deb
sudo apt-get install -y ./grafana_13.0.2_amd64.debSetting up grafana (13.0.2) ...
info: Adding system user `grafana' (UID 134) with group `grafana' ...
### NOT starting on installation, please execute ...
sudo /bin/systemctl enable grafana-server
sudo /bin/systemctl start grafana-serverPick the latest version from the Grafana download page if 13.0.2 is superseded. If curl fails with HTTP/2 stream ... PROTOCOL_ERROR through a proxy, use wget or curl --http1.1.
Check the binary version:
/usr/sbin/grafana-server -vDeprecation warning: 'grafana-server' is deprecated and will be removed in a future release. Use the 'grafana server' subcommand instead.
Version 13.0.2 (commit: 3fcdbc5a, branch: release-13.0.2)Newer packages prefer grafana server over the grafana-server wrapper—the systemd unit name stays grafana-server.service.
Step 3: Enable and start the service
sudo systemctl daemon-reload
sudo systemctl enable --now grafana-server
systemctl is-active grafana-serveractiveFirst boot can take 15–30 seconds while Grafana runs database migrations. Tail logs if the UI is slow to appear:
journalctl -u grafana-server -fLook for a line similar to HTTP Server Listen on port 3000.
Step 4: Verify Grafana is listening
ss -tlnp | grep ':3000'LISTEN 0 4096 *:3000 *:*Health endpoint:
curl --noproxy '*' -sS http://127.0.0.1:3000/api/health{
"database": "ok",
"version": "13.0.2",
"commit": "3fcdbc5a"
}Login page:
curl --noproxy '*' -sS -o /dev/null -w 'HTTP:%{http_code}\n' http://127.0.0.1:3000/loginHTTP:200Use --noproxy '*' when a system HTTP proxy breaks localhost checks—the same pattern as other local service tests on this host.
Step 5: First login and password change
- Open
http://YOUR_SERVER_IP:3000in a browser (replace with the machine’s LAN address). - Sign in with
admin/admin. - Set a strong password when prompted.
After curl returns HTTP 200 on /login, the browser UI on Grafana 13.0.2 should look like this:
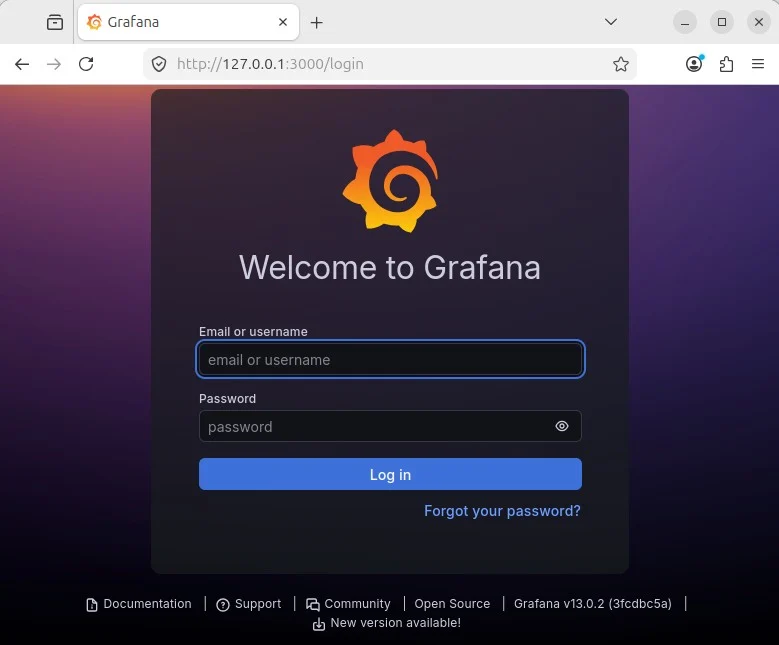
Enter admin for both fields on a fresh install, then click Log in. Grafana immediately asks you to replace the default password—do that before you open port 3000 to the LAN:
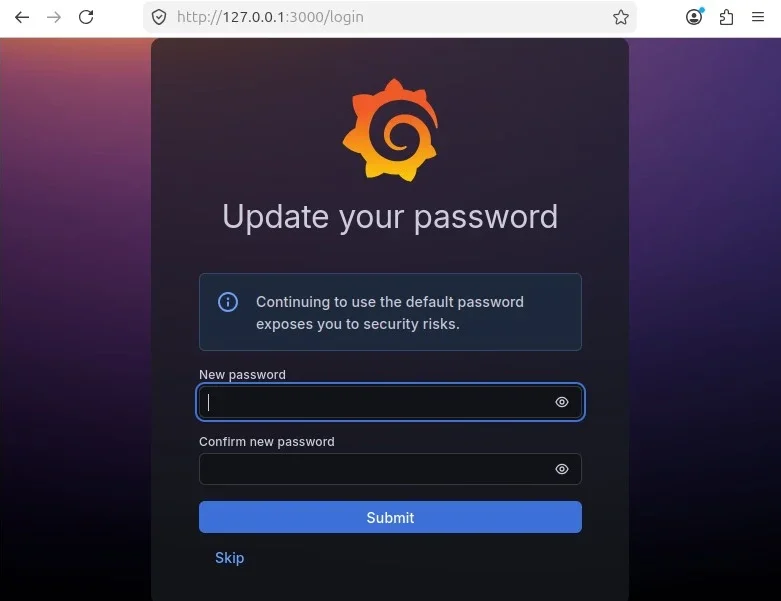
Choose a long random password and store it in your password manager. You land on an empty Home dashboard once the change succeeds.
Paths and config:
| Item | Location |
|---|---|
| Main config | /etc/grafana/grafana.ini |
| Data / plugins | /var/lib/grafana |
| Logs | /var/log/grafana |
| Provisioning | /etc/grafana/provisioning |
| Service user | grafana |
To listen only on localhost, set http_addr = 127.0.0.1 in grafana.ini and restart the service.
Firewall (UFW)
If UFW is active, allow Grafana from your LAN only:
sudo ufw allow from 192.168.0.0/16 to any port 3000 proto tcp comment 'Grafana UI'Do not expose port 3000 to the public internet without TLS and authentication hardening.
Add Prometheus as a data source (brief)
After Grafana is up and you have Prometheus listening (for example on port 9090):
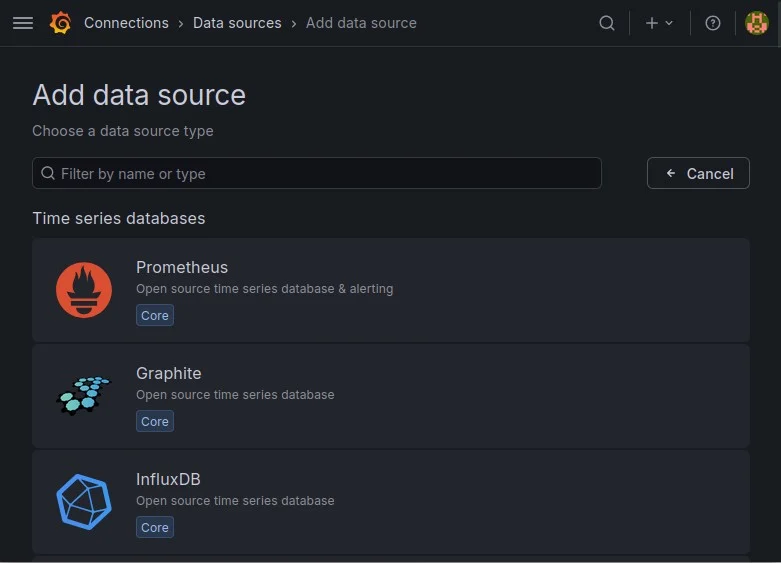
- Open the left menu → Connections → Data sources → Add new data source.
- Choose Prometheus.
- Set URL to
http://127.0.0.1:9090when Prometheus runs on the same host, orhttp://PROMETHEUS_IP:9090on another machine. - Leave Access as Server (default) unless you have a reason to query from the browser.
- Click Save & test—you should see a green “Successfully queried the Prometheus API” message.
If Save & test fails, confirm Prometheus is running (curl http://127.0.0.1:9090/-/healthy) and that nothing blocks traffic between Grafana and that URL.
For file-based config, drop a YAML file under /etc/grafana/provisioning/datasources/. Install and scrape Prometheus on Ubuntu separately, then point Grafana at http://127.0.0.1:9090.
Uninstall Grafana
sudo systemctl stop grafana-server
sudo apt-get purge -y grafana
sudo rm -f /etc/apt/sources.list.d/grafana.list /etc/apt/keyrings/grafana.asc
Remove /var/lib/grafana when you no longer need dashboards, plugins, or the SQLite database.
Troubleshooting
| Symptom | Likely cause | Fix |
|---|---|---|
Release file ... not valid yet |
System clock behind repo metadata | sudo timedatectl set-ntp true; retry or use .deb |
curl: (7) Failed to connect right after start |
Migrations still running | Wait 30s; check journalctl -u grafana-server |
curl 403/000 on localhost |
HTTP proxy | curl --noproxy '*' |
| Port 3000 already in use | Another service | ss -tlnp | grep 3000; change http_port in grafana.ini |
| Cannot log in after password change | Browser cache / wrong user | Use private window; reset admin password per Grafana docs |
grafana-server: command not found |
PATH | Use /usr/sbin/grafana-server or grafana server |
References
- Install Grafana on Debian or Ubuntu (official)
- Start the Grafana server
- Grafana download page
- Grafana Alloy documentation
Summary
To install Grafana on Ubuntu, add the signed apt.grafana.com repository, run sudo apt install grafana, and enable grafana-server. Open http://SERVER:3000, sign in as admin, and change the default password. Verify with /api/health and ss on port 3000. If apt update complains the release file is not valid yet, sync time or install the current grafana_*_amd64.deb from dl.grafana.com. Add Prometheus (or another source) in the UI, and put TLS in front before you expose dashboards beyond your LAN.