![Learn Node.js debugging Tips & Tricks [With Examples]](/node-js-debugging-tips-tricks/node-js-debugging-tips-tricks.webp)
You have installed Node.js on your system and are comfortable writing JavaScript on code editors like Visual Studio Code. However, you still find it hard to debug your applications. Worry no more.
This tutorial teaches you how to get started with Node.js debugging on the terminal. You will not install any extension or package because we will utilize the built-in Node.js debug tools.
First, it would help to understand the sources of errors in your code.
Node.js debug syntax errors
Syntax errors are the most familiar and easiest to debug. They mainly result from missing brackets, poor indentation, or using undeclared variables.
Most modern code editors will underline syntax errors. Better yet, the terminal prints the error on running the code.
For example, assume you are about to run this code on the terminal.
const companyEmployees = ['Doe', 'Lorem', 'Ipsum']

for (let employee in campanyEmployees) {
console.log(employee)
}Save the code, exit the code editor then run the file using the node command.
node [file name]![Learn Node.js debugging Tips & Tricks [With Examples]](/node-js-debugging-tips-tricks/syntax-errors-e1655882845796.webp)
The terminal tells you the line with the error and the exact variable causing the error.
Node.js debug logical errors
Node.js debugging on logical errors can be troublesome because your code often runs without shouting errors, yet you don't get the expected output. The errors mainly result from inappropriate conditions and using the unintended variables.
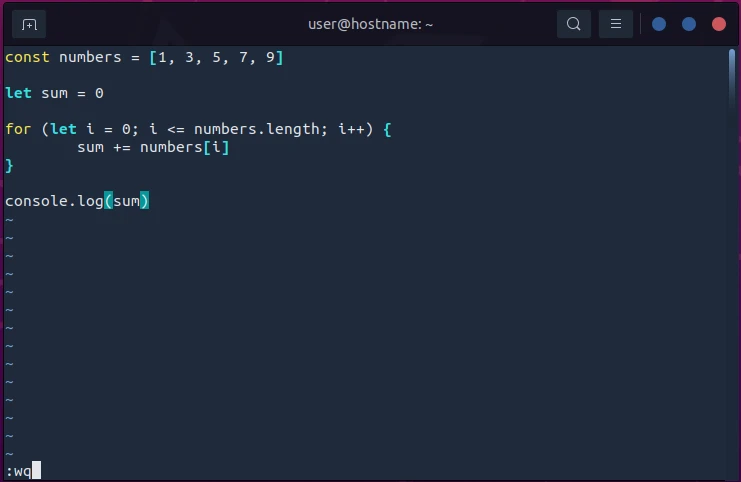
Assume you want to get the sum of the first five odd numbers using a
for loop. You write the code in the Vim editor.
const numbers = [1, 3, 5, 7, 9]
let sum = 0

for (let i = 0; i <= numbers.length; i++) {
sum += numbers[i]
}

console.log(sum)You save the file.
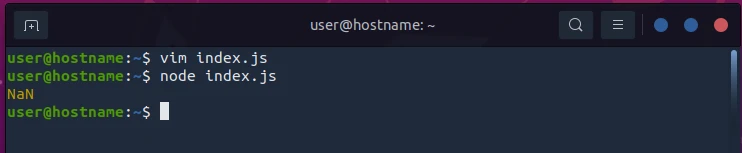
And run the file on the terminal.
node index.jsAnd to your surprise, the output is not a number, yet you expected an integer of the value 25!
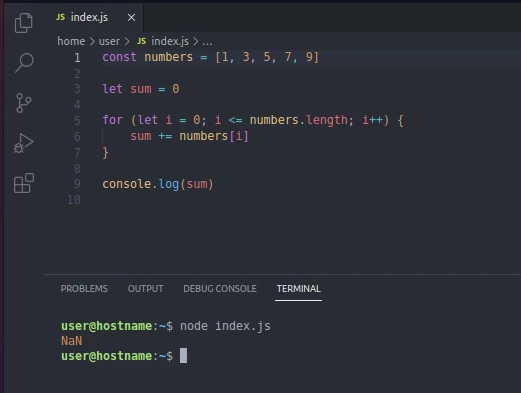
You restructure your code but still cannot catch the error. You run the file with Visual Studio Code,
hoping to see the error with extensions, but you still cannot understand
why the output is NaN and not 25.
Here are the typical Node.js debug options for logical errors.
Use the console.log()
The quickest way to Node.js debug your applications is to log the output
on the console. For example, our target output from the above code is
the sum. So, there is a high chance the problem occurs inside the
loop, as we add the values of each iteration i.
Let's console-log each value of i and see when the code breaks.
const numbers = [1, 3, 5, 7, 9]
let sum = 0

for (let i = 0; i <= numbers.length; i++) {
console.log(sum += numbers[i], i)
}

// console.log(sum)
We have commented out the sum outside the loop and monitoring how it
gets built inside the for loop. Running the file, you get the
following output:
1 0
4 1
9 2
16 3
25 4
NaN 5
From the output, it seems our code breaks at the last loop. That means we are looping beyond the length of the (numbers) array.
Let's update the loop condition from i <= numbers.length; to
i < numbers.length; then rerun the file.
Although logging output on the console is a quick way to Node.js debug applications, it is unsuitable for a large codebase and is often prone to errors. It would be best to use Node.js inspector instead.
Use the Node.js debug inspector
Node.js presents you with multiple ways to catch logical errors in your
code. The inspect option is one of the recommended ways to Node.js
debug a small code size line by line.
Here, the node command takes the inspect option and the entry file's
name.
node inspect index.jsRunning the command enters the debug mode with the following output:
< Debugger listening on ws://127.0.0.1:9229/a3c6870a-70d1-4d44-9291-b6c4ce3d007e
< For help, see: https://node.js.org/en/docs/inspector
<
connecting to 127.0.0.1:9229 ... ok
< Debugger attached.
<
Break on start in index.js:1
> 1 const numbers = [1, 3, 5, 7, 9]
2
3 let sum = 0
debug>
The debugger server listening on port 9229 allows us to debug the
application with external clients. The message
connecting to 127.0.0.1:9229 ... okshows the debugger is currently attached to the machine's (local)
network. The code's execution stops presently at line 1 as denoted by
the forward arrow >.
Break on start in index.js:1The debug prompt (where we type commands) comes after the numbered lines of code.
debug>Typical commands are:
n: Move to the next line, skipping the empty lines.c: Continue the execution till the next breakpoint or the program's end.watch: Track a variable or expression's value change. Similarly, you can untrack an element using theunwatchcommand.pause: Halt the execution.s: Step into a function.o: Step out of a function..exit: Stop Node.js debugging and get out of the debug terminal.
The debugger highlights the code portion it is about to execute, for example, the initializer, the array's length property, and the sum variable inside the loop.
Let's watch the target variables: the sum value that gets changed by
the i counter.
debug> watch('sum')
debug> watch('i')
Meanwhile, keep moving to the subsequent lines (using the n command)
as you monitor the sum and i values. Once you have visited each
target variable at least once (but before the first iteration), their
values become zero.
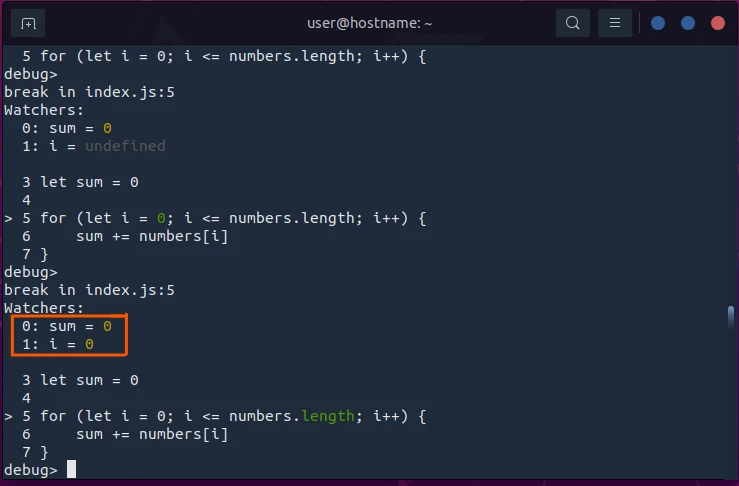
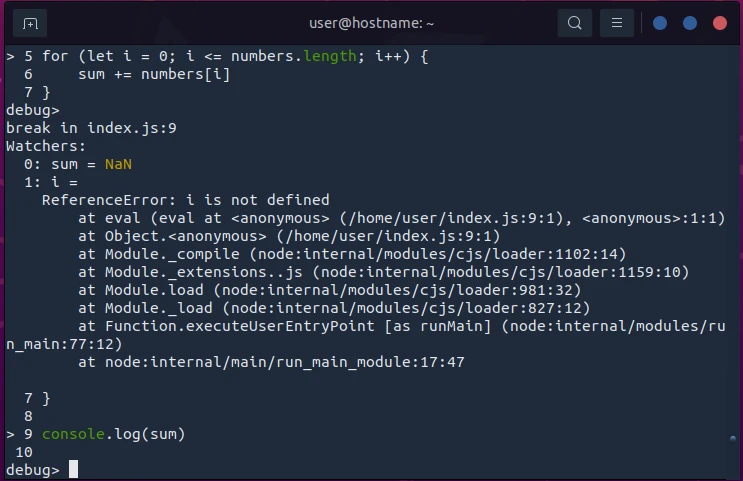
At the end of the fourth iteration, the sum is 25. At the end of the
fifth iteration, the sum is NaN, and soon i becomes undefined
because we are out of the loop.
Although we debugged the code, we consumed much time. That makes the
inspect option less efficient for a large codebase. The most immediate
solution is using the built-in Node.js debugger breakpoints.
Use the Node.js debugger breakpoints
Node.js debugger allows us to create breakpoints in the areas of the code we want to jump to and test their execution.
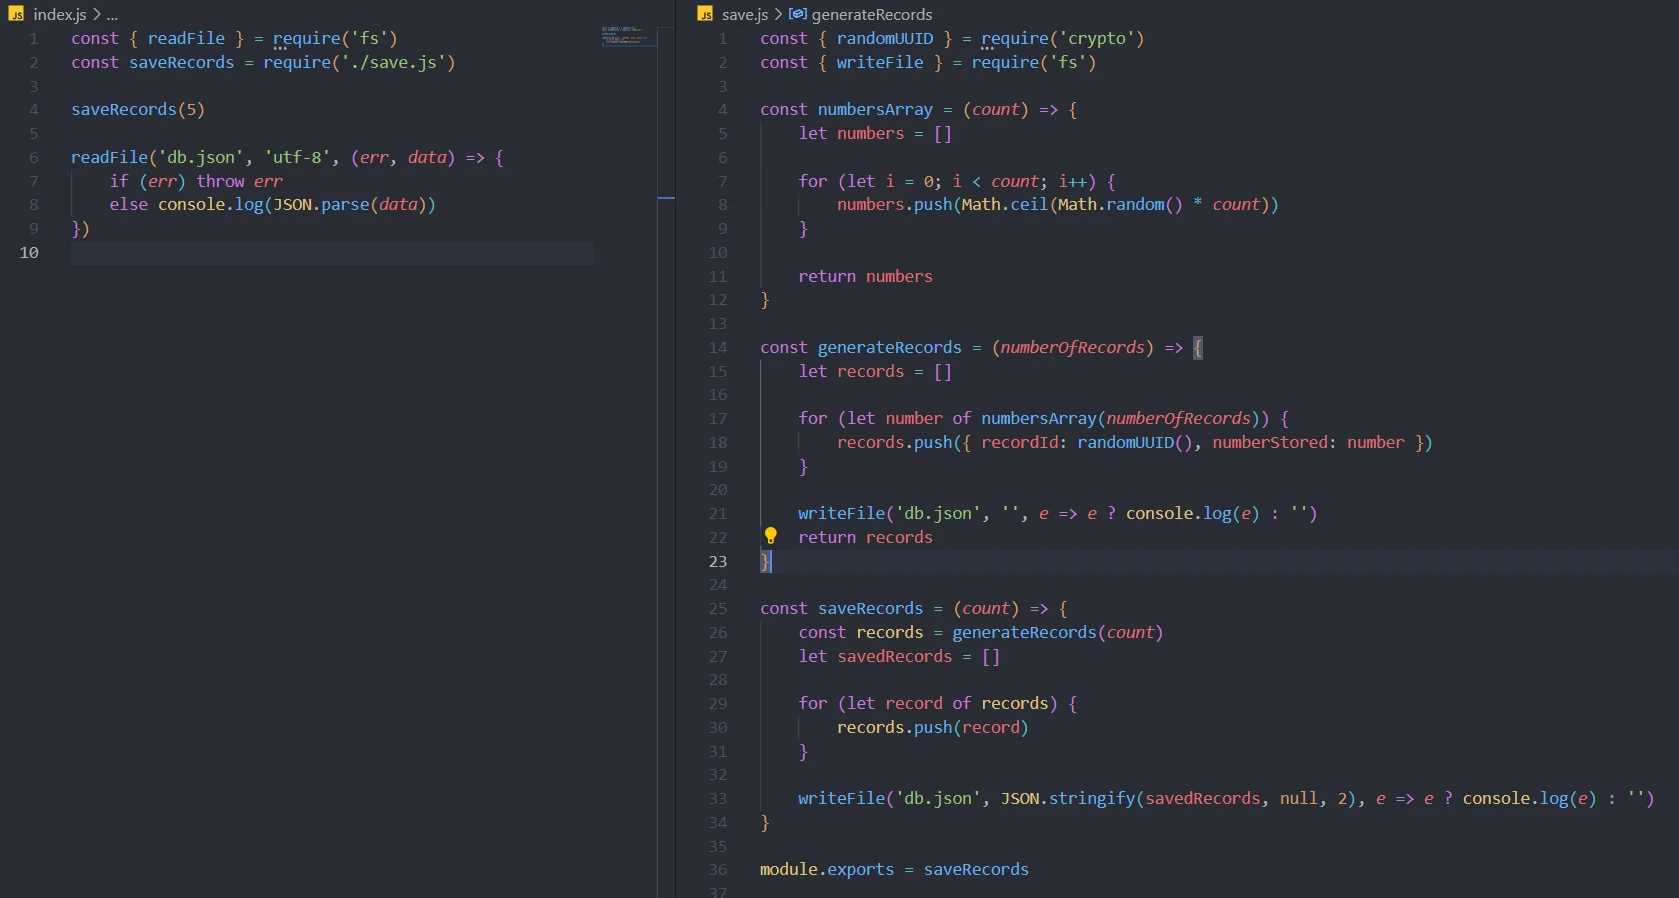
Assume we want to build a simple database with an array of random
numbers and unique IDs, then read the database contents using the
readFile() method of the fs module.
Project setup
We generate a random array of numbers,
const numbersArray = (count) => {
let numbers = []

for (let i = 0; i < count; i++) {
numbers.push(Math.ceil(Math.random() * count))
}

return numbers
}create a record of a unique id from each of the array's elements,
const { randomUUID } = require('crypto')

const generateRecords = (numberOfRecords) => {
let records = []

for (let number of numbersArray(numberOfRecords)) {
records.push({ recordId: randomUUID(), numberStored: number })
}

writeFile('db.json', '', e => e ? console.log(e) : '')
return records
}And save the collection of records in a JSON file.
const { writeFile } = require('fs')

const saveRecords = (count) => {
const records = generateRecords(count)
let savedRecords = []

for (let record of records) {
records.push(record)
}

writeFile('db.json', JSON.stringify(savedRecords, null, 2), e => e ? console.log(e) : '')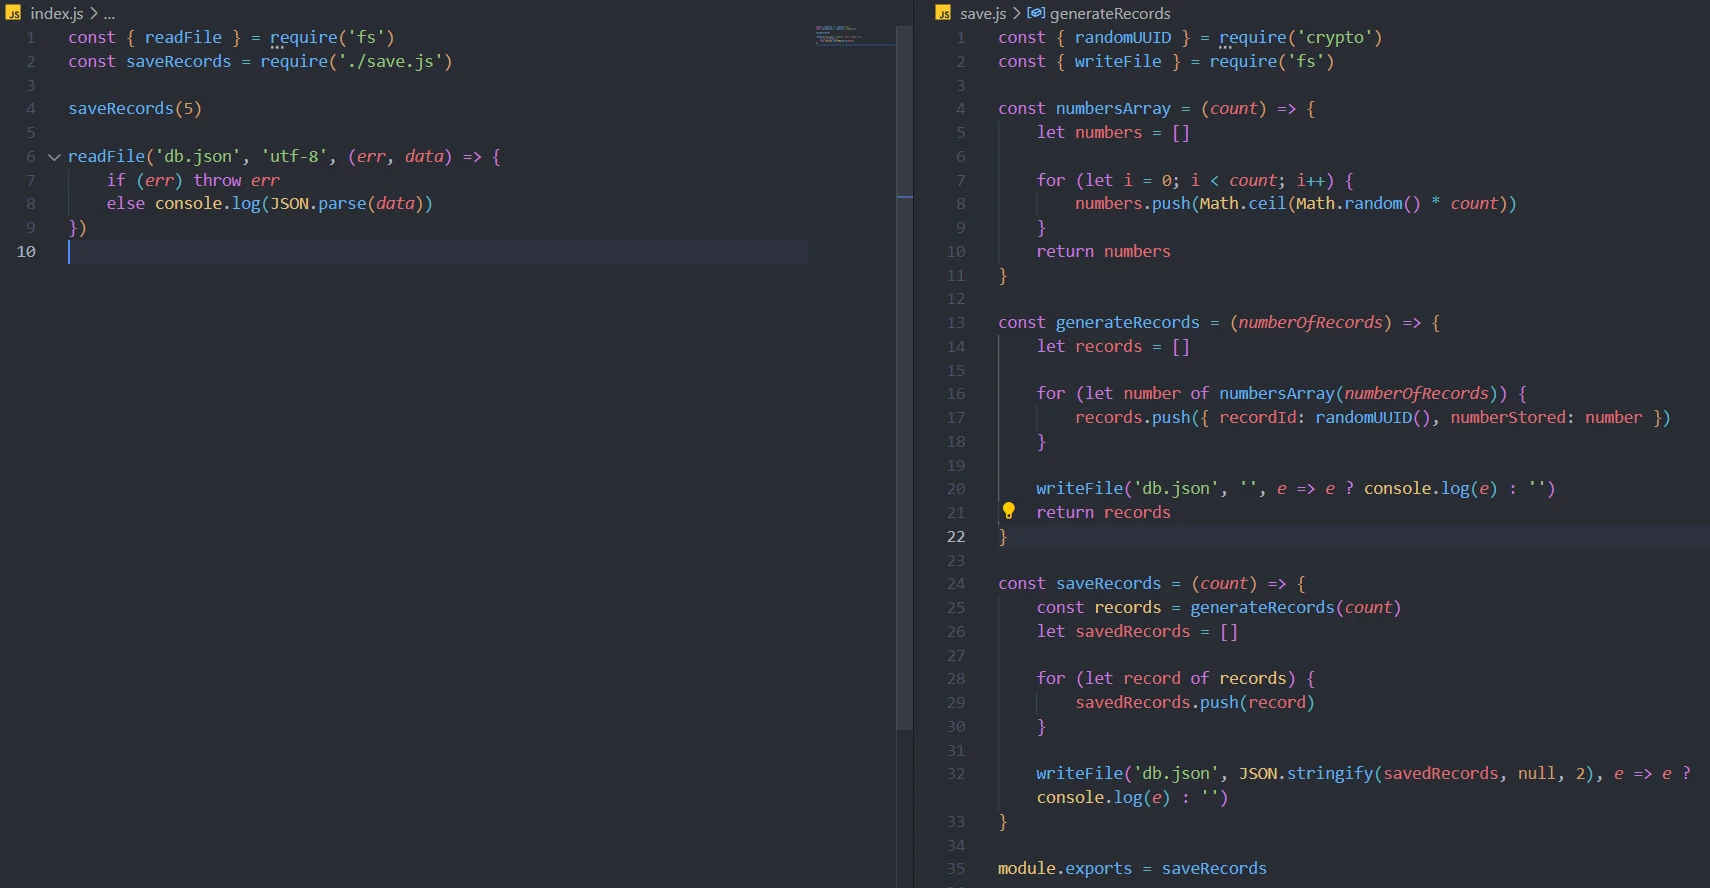
}Lastly, we export the custom module
module.exports = saveRecordsinto the entry index.js file.
const { readFile } = require('fs')
const saveRecords = require('./save.js')

saveRecords(5)

readFile('db.json', 'utf-8', (err, data) => {
if (err) throw err
else console.log(JSON.parse(data))
})And run the custom module's saveRecords() function with a count of 5.
Lastly, we read the db.json file.
Expectations vs output
We expect to create a db.json file with an array of objects containing
unique IDs and saved integers on running the index.js file on the
terminal.
node index.jsInstead, the execution does not stop until we stop it with ctrl+c.
Yes, a db.json file is created. But it is empty.
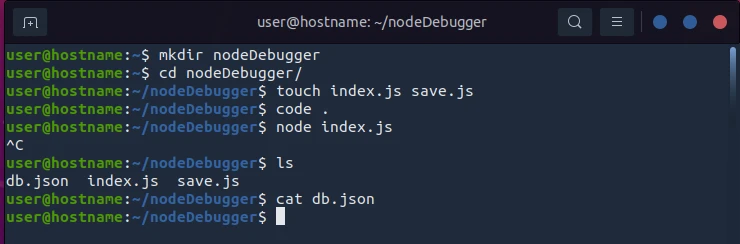
Let's find out why the output is unexpected.
Find the problem with the Node.js debugger
The output shows that the file is written, but the data is not saved. So, did we
- return the array of random numbers?
- generate and return unique records?
- save the records?
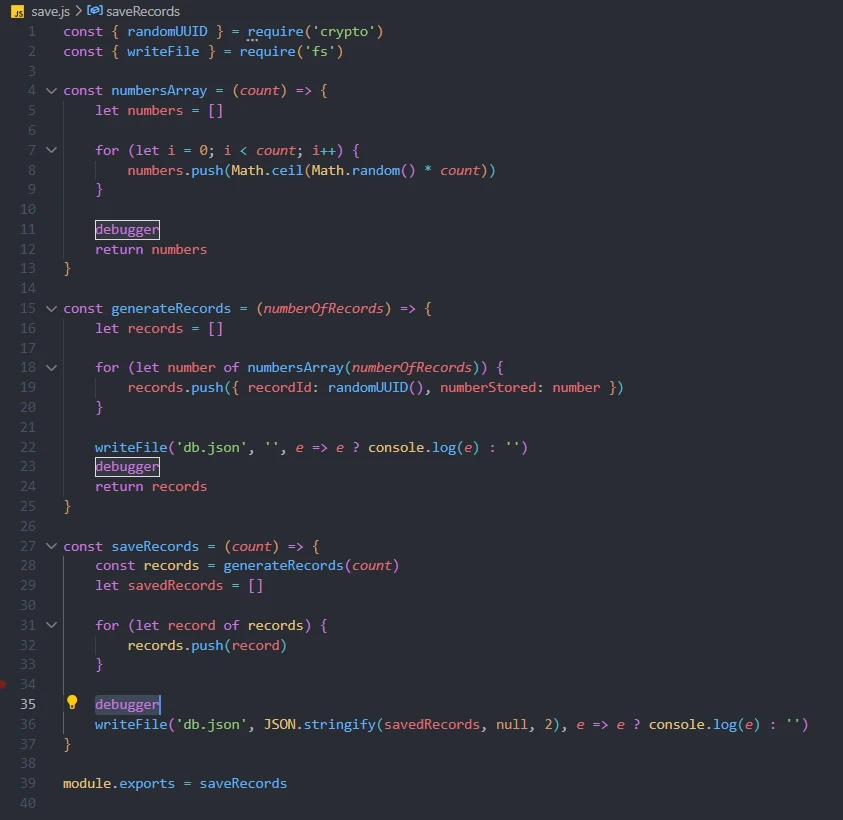
Let's check by putting the (debugger) breakpoints before:
- returning the numbers from the
numbersArrayfunction,
const numbersArray = (count) => {
let numbers = []

for (let i = 0; i < count; i++) {
numbers.push(Math.ceil(Math.random() * count))
}

debugger
return numbers
}2. returning the records from the generateRecords() function,
const generateRecords = (numberOfRecords) => {
let records = []

for (let number of numbersArray(numberOfRecords)) {
records.push({ recordId: randomUUID(), numberStored: number })
}

writeFile('db.json', '', e => e ? console.log(e) : '')
debugger
return records
}3. writing the data into the savedRecords array in the
saveRecords() function.
const saveRecords = (count) => {
const records = generateRecords(count)
let savedRecords = []

for (let record of records) {
records.push(record)
}

debugger
writeFile('db.json', JSON.stringify(savedRecords, null, 2), e => e ? console.log(e) : '')
}
Return to the terminal and run the entry script with the inspect option.
node inspect index.jsRun the c command to move to the first/next breakpoint.
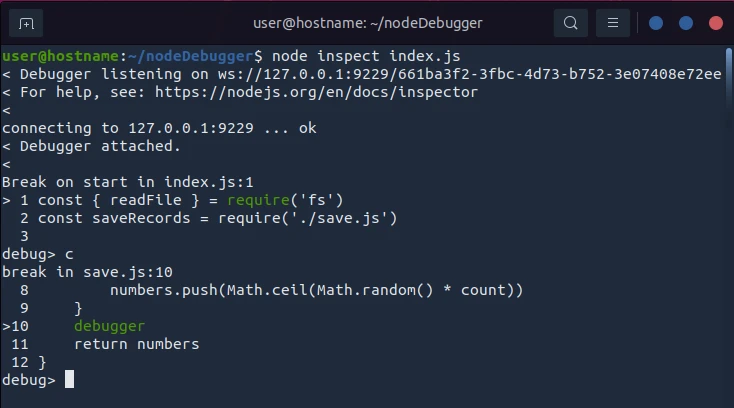
Let's watch the numbers while moving to the following execution line
using the n command.
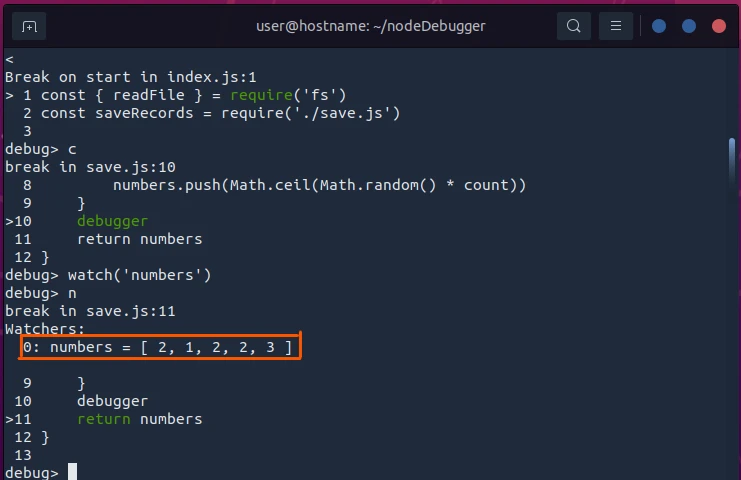
debug> watch('numbers')
debug> n
From the output, there is no problem with the numbersArray() function
because it generates and returns an array of five numbers.
Let's unwatch the numbers variable before continuing to the next
breakpoint.
debug> unwatch('numbers')
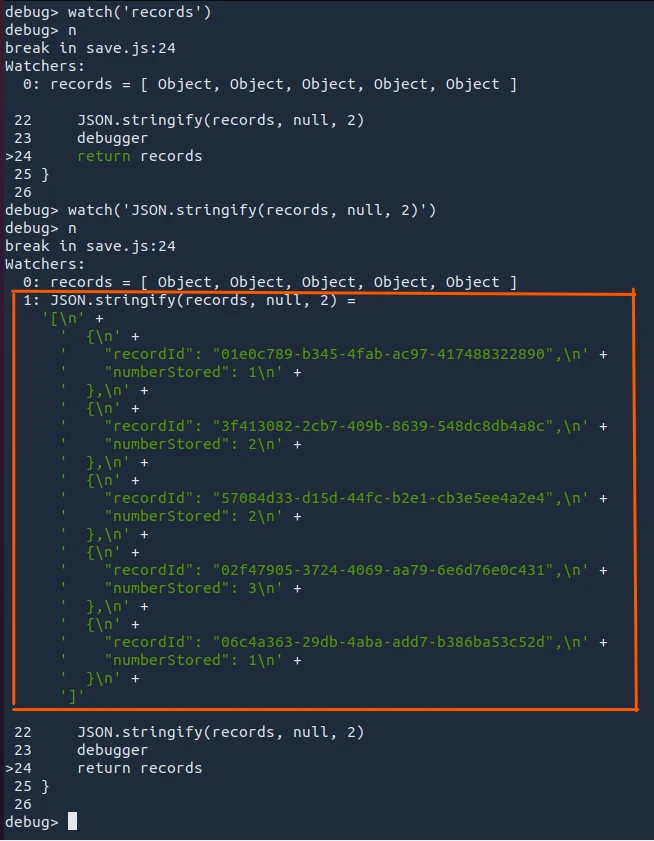
debug> cLet's watch the records variable as we move to the following line.
debug> watch('records')
debug> n
The generateRecords()function returns five objects. Let's see the
contents of the objects using the JSON.stringify() method.
Stop the debugging session,
debug> .exitopen the save.js file and stringify the objects by adding the
JSON.stringify(records, null, 2) line before the debugger
breakpoint.
const generateRecords = (numberOfRecords) => {
let records = []

for (let number of numbersArray(numberOfRecords)) {
records.push({ recordId: randomUUID(), numberStored: number })
}

writeFile('db.json', '', e => e ? console.log(e) : '')
JSON.stringify(records, null, 2)
debugger
return records
}Return to the terminal and continue debugging the code.
node inspect index.jsAnd continue into the generateRecords() function's breakpoint before
watching the added expression.
debug> watch('JSON.stringify(records, null, 2)')
debug> n
There is no problem with the generateRecords() function because it
returns the expected object.
Let's exit the debug mode, remove the JSON.stringify(records, null, 2)
line, return to the debug terminal and continue debugging to the next
breakpoint.
The debugger runs for a long time when we reach the last breakpoint, then stops, returning a fatal error that mentions size somewhere.
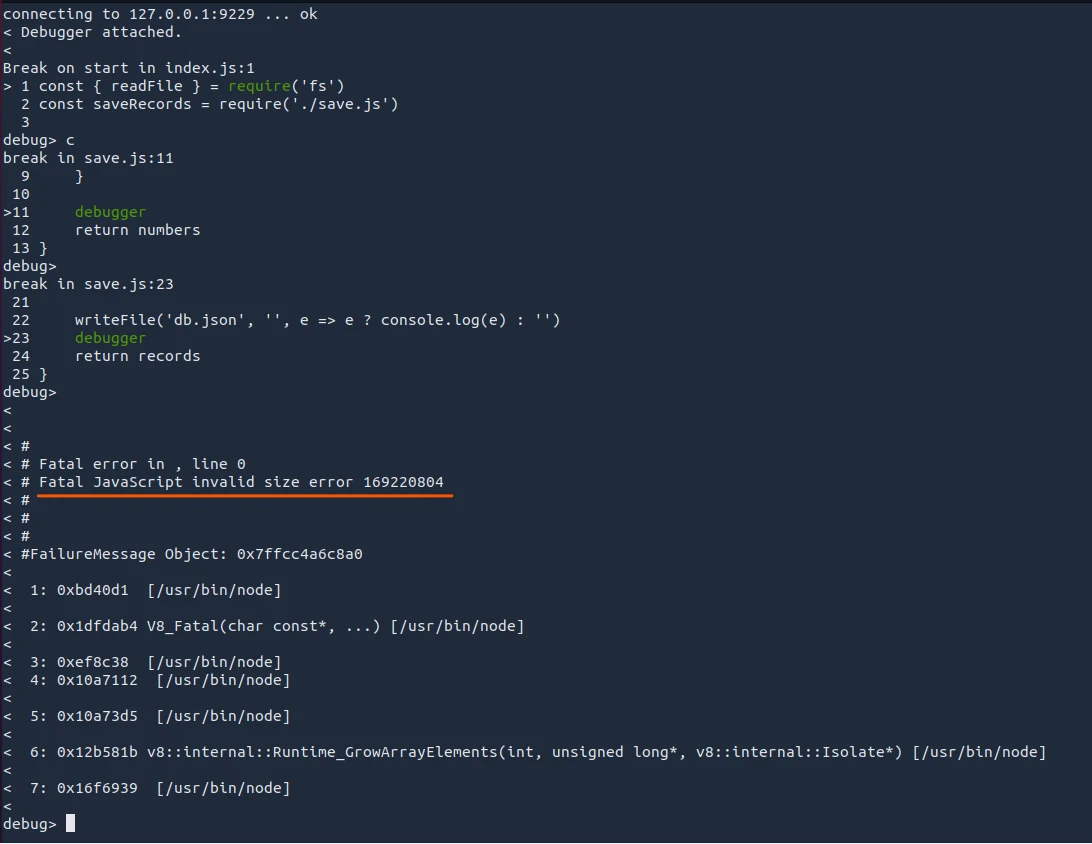
Even before we watch conditions, we can tell the problem lies in the
saveRecords() function.
Solve the problem
Now that we have spotted the function with the problem, let's adjust the
breakpoints to focus on the saveRecords() function only.
Remove the debugger from the numbersArray() and generateRecords()
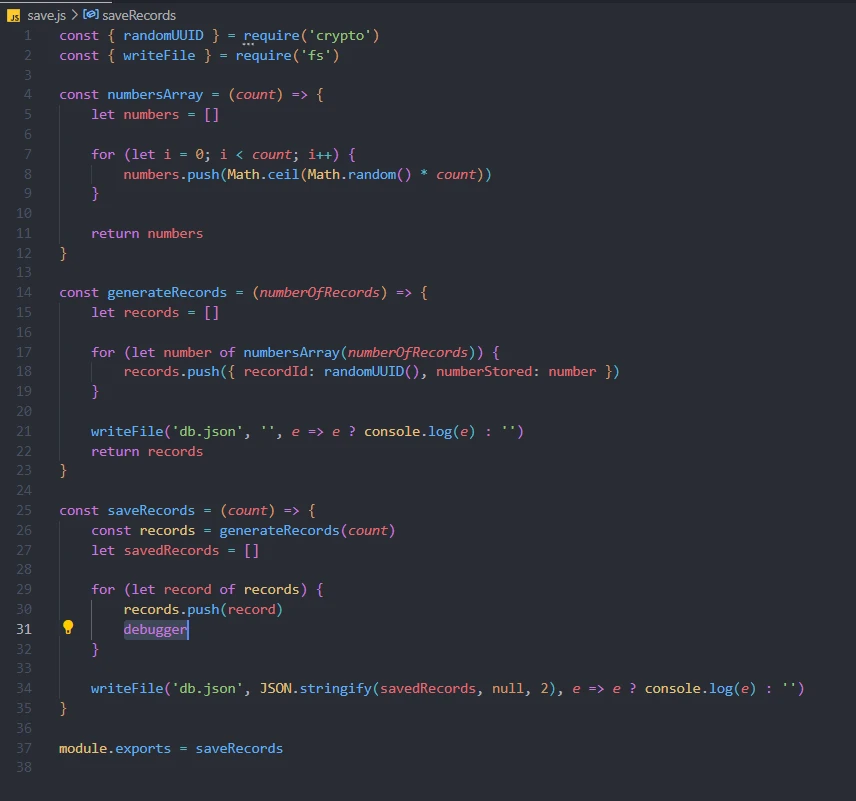
functions. And adjust its position inside the saveRecords(): inside
the loop, and after pushing an element into the target array.
Return to the terminal and continue debugging the application.
node inspect index.js
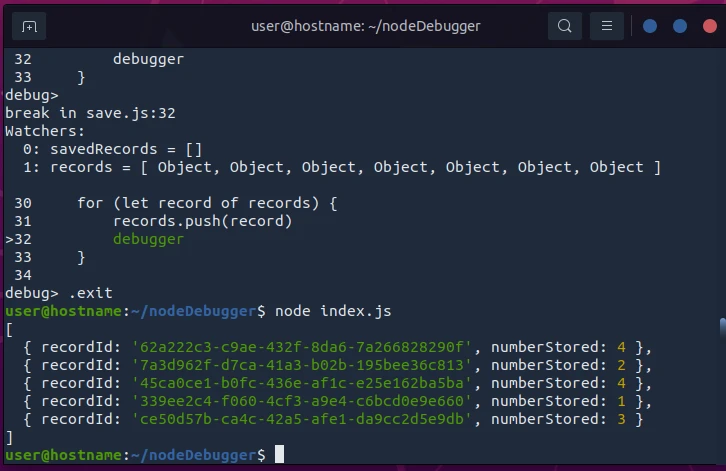
debug> cLet's watch the savedRecords array and the records array changing
it.
debug> watch('savedRecords')
debug> watch('records')
debug> n
What did you notice?
- The size of the
savedRecordsarray does not change, - The size of the
recordsarray grows, - The loop does not end
It turns out that we were continually pushing the records array's
elements into itself instead of the savedRecords array.
Let's stop the debugging and correct the problem.
debug> .exitLet's return to the saveRecords() function's implementation and change
its content
from:
const saveRecords = (count) => {
const records = generateRecords(count)
let savedRecords = []

for (let record of records) {
records.push(record)
debugger
}

writeFile('db.json', JSON.stringify(savedRecords, null, 2), e => e ? console.log(e) : '')
}to:
const saveRecords = (count) => {
const records = generateRecords(count)
let savedRecords = []

for (let record of records) {
savedRecords.push(record)
}

writeFile('db.json', JSON.stringify(savedRecords, null, 2), e => e ? console.log(e) : '')
}
Return to the terminal and run the entry script.
node index.jsWe now have the expected output.
Conclusion
In this tutorial, you learned Node.js debugging using the
console.log(), and the Node.js inspect option: with and without the
debugger breakpoints. Before that, the tutorial walked you through the
types of errors you are likely to run into while using Node.js.
It would be best to familiarize yourself with the tools you have learned in this tutorial. After that, you can dive into Node.js debugging with specific code editors,' and the browser's debug tools. For example, you can use Visual Studio Code's built-in debugger or Google Chrome's Developer tools.