
In this article, we will cover tips on how to find the problems that arise at any time. It is not possible to include every solution here. However, the article will contain most common and effective troubleshooting methods which we will help you learn how to use Wireshark.
Capturing Packets Using Ring Buffer
A problem may occur intermittently, which makes it difficult to diagnose. If you do not know when the problem arises, you need to wait and capture the packets until you encounter it again. However, waiting too much may create large trace files which are not suitable for filtering and statistic reports. The larger the file gets the more time it takes to filter packets. Instead of using a single large capture file, Wireshark can save the packets into multiple smaller files. However, even if you save packets into multiple smaller files, you may run out of the free space on your hard drive with this way. There is a solution called Ring Buffer for this caveat, which limits the number and the size of the files. It works with specifying the number and size of files. After starting the capture, Wireshark saves the packets to these files and once all files filled with packets, it goes back and overwrites the first one then the second one then the third one and so on. Following steps show how to create a Ring Buffer.
Step-1: Launch Wireshark and navigate to Capture → Options menu.
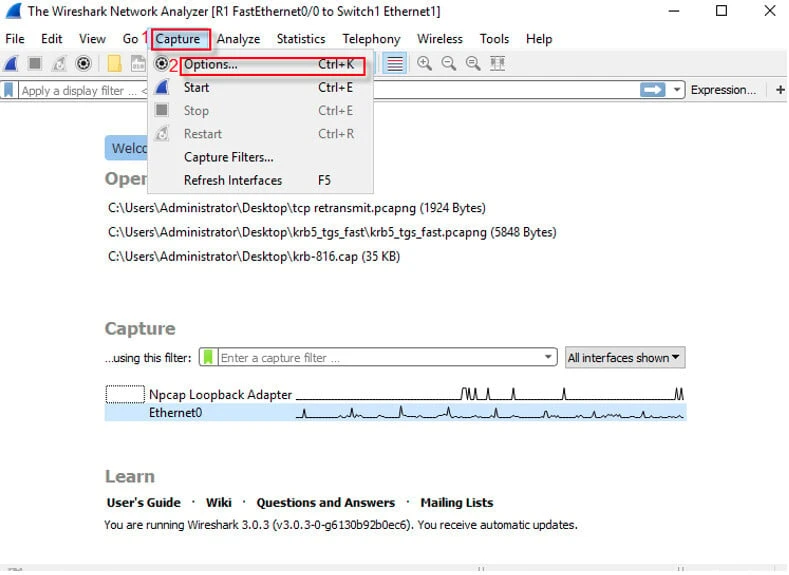
Step-2: A window appears**,** select your interface from the list and go to the “Output” tab.

Step-3: From “Output” tab, we can limit the size and the number of files that will be created.
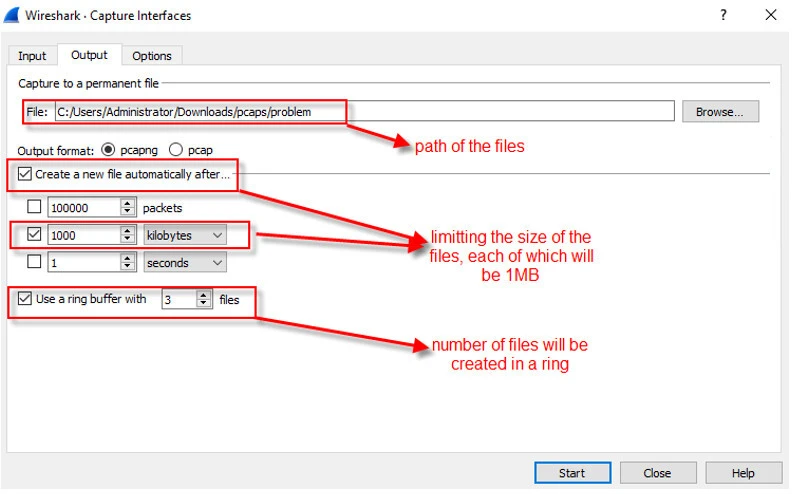
After starting the capture, all packets will be saved to the files like below.
Using Filters
During troubleshooting, too many packets may become a distraction for us, so filtering out not relevant traffic is very important. There are two types of filters in Wireshark:
1. Capture Filter
This filter is used to limit the packet capture. For example, if you are interested in capturing only traffic coming from or going to Example Domain (example.com), you can follow the steps below.

2. Display Filter
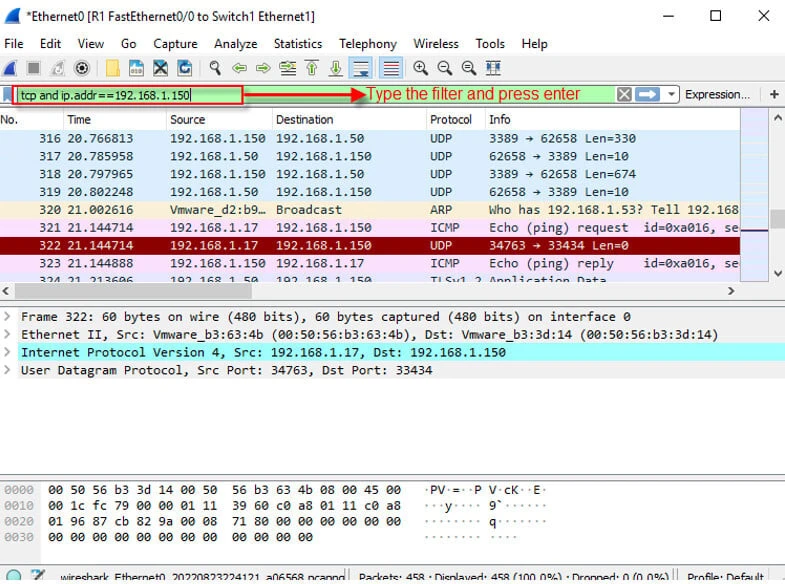
Display filters allow you to concentrate on the packets you are interested in while hiding the currently uninteresting ones. Unlike capture filter, display filter does not limit the capturing packets, it only hides the packet you are not interested in. Following screenshot shows how to create a display filter.
**
**
Adding Time and Delta Columns
Latency can badly influence performance of some protocols. We can determine if the latency is an issue with the client, the path, or the server by using Wireshark, which supports adding custom columns. Follow the steps below to add time and delta time columns.
Step-1: Right click on any column and navigate to “Column Preference”.
**

**
Step-2: Wireshark Preferences window opens. Click on the plus button to create a new column like below.
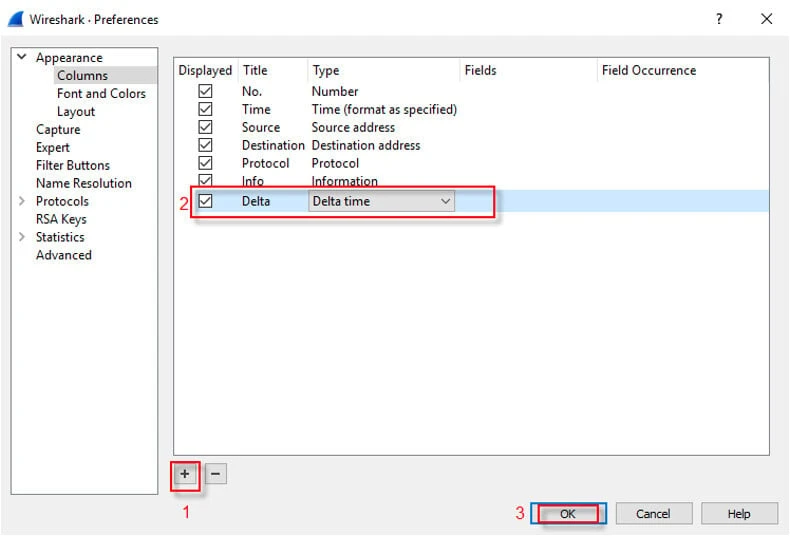
Delta column is the time from the previous packet to the current packet in a conversation. If we want to use this column effectively, we need to filter packets properly. Following screenshot shows the latency (delay) between the packets in the delta column. As seen below, there is no major distinction in the column. If you have a problem related the latency or packet loss, you may see much bigger delta times in the column.

Focusing on Red and Black Colored Packets
Wireshark uses colors to help you identify the types of traffic at a glance. In Wireshark, any packet marked in black is considered to reflect some sort of issue. When Wireshark detects potential problems, it colors them with red text on a black field. After filtering the packets, focusing on these red and black colored packets may shorten the duration of the troubleshooting.

Using Expert Information
Wireshark keeps track of any anomalies and other items of interest it finds in a capture file and shows them in the Expert Information dialog. The goal is to give you a better idea of uncommon or notable network behavior and to let novice and expert users find network problems faster than manually scanning through the packet list. Follow the steps below to check the expert info.
Step-1: Navigate to Analyze à Expert Information.

Step-2: You will see the number of the errors, warnings, notes so on in the list like below.

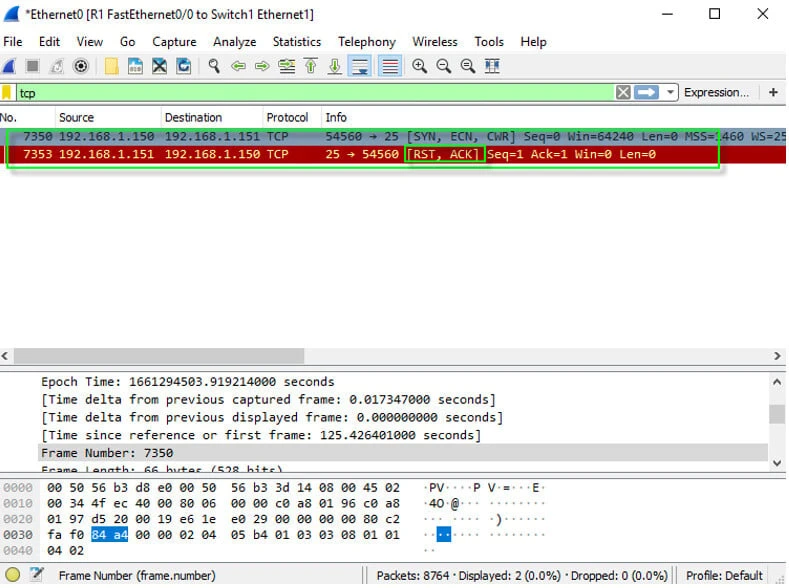
Analyzing TCP Reset Flag
When an unexpected TCP packet arrives at a host, the TCP RST flag is used to reset the connection. It indicates that the receiver should delete the connection. The receiver deletes the connection based on the sequence number and header information and frees the resources. Receiving a packet with RST flag set can be interpreted differently depending on when it is received:
Just after SYN packet: It means that there is no a service working on the port. It also indicates that the port is closed.
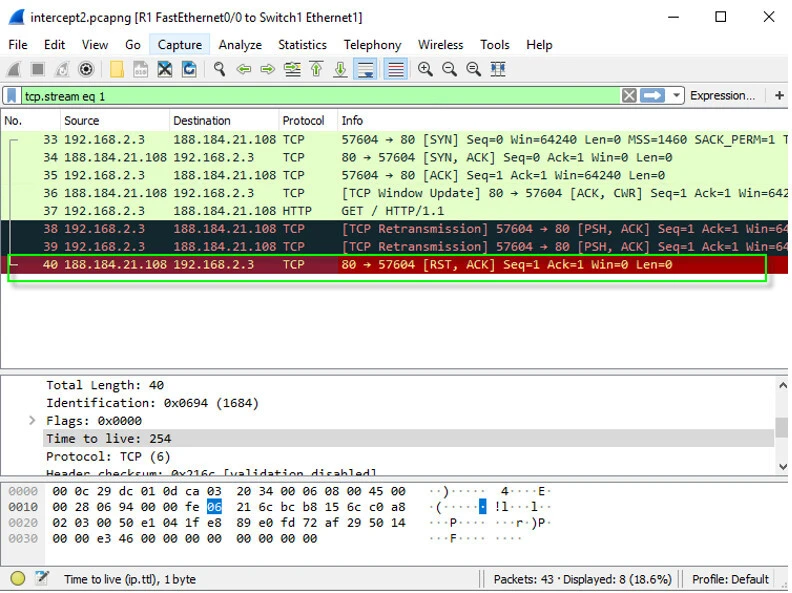
In the Middle of the Conversation (Before a Packet without FIN Flag): It generally indicates that something unexpected happened or a security device drop the connection. To make sure if it was dropped by a security device in between the client and the server, the TTL value in the packet should be investigated.
After a Packet with FIN Flag: A packet with FIN flag gracefully requests the termination of a TCP connection. However, some clients or servers uses a packet with RST flag set to terminate the connection. This kind of terminations are not big deal, most of time.
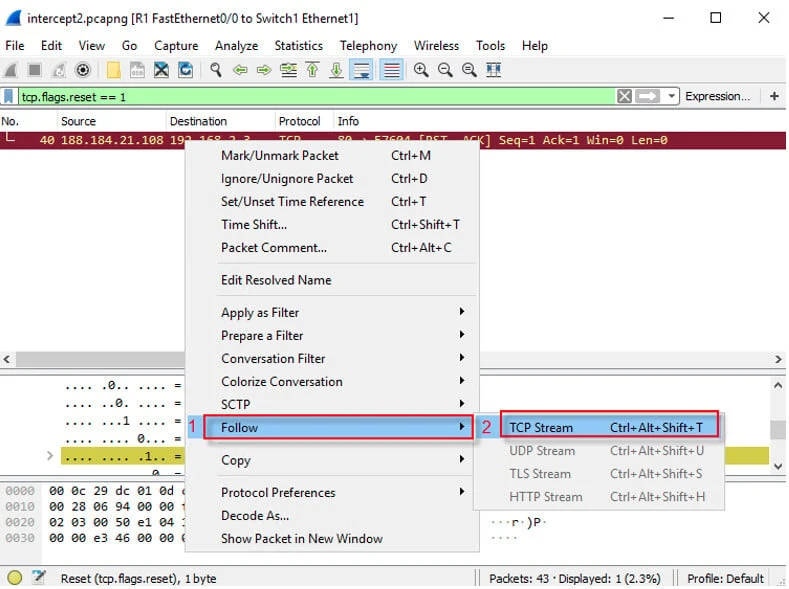
To find flow with RST flag, display filter of “tcp.flags.reset == 1” can be used. Once finding the flows, we can pick one of them to investigate it closely as seen below.
**
**
Analyzing ICMP packets
Like TCP RST flag, there is also a method to check if a UDP port is in service or not. When the client sends a UDP packet to the server, the server checks if there is an application listening on the port. If it notices the port is not listened by any application, it responds with a special ICMP packet telling the port is closed. Following screenshot shows that there is no a TFTP application running on the server.

Display filter of “(icmp.type == 3) || (icmp.code == 3)” can be used to find out if there is a working application on the server, which provides the service over UDP.
Decrypting TLS Conversations
Transport Layer Security (TLS) is a cryptographic protocol designed to provide communications security over a computer network. When TLS is used, the packets can not be investigated closely due to the encryption. Decrypting TLS provides us visibility in terms of application layer data. You can check more from here (Wireshark Decrypt Ssl Tls Tutorial) or here (decrypt RDP traffic with Wireshark)
Checking Application Status Codes or Error Messages
Most of application layer protocols (HTTP, DHCP, DNS, TFTP etc.) send a packet that specifies its status with a code or an error message showing why the request failed when an unexpected situation happens. Filtering based on these codes or messages helps a lot to find the root cause. Following screenshot shows why the TFTF transfer failed.

For example, HTTP uses status codes below.
- Informational responses (100–199)
- Successful responses (200–299)
- Redirection messages (300–399)
- Client error responses (400–499)
- Server error responses (500–599)
If we wanted to list the server errors, we would have used “http.response.code>499 and http.response.code < 600” as a display filter.
Using Wireshark Statistics
Wireshark Statistics menu contains many useful statistics. “Protocol Hierarchy Statistics” can be used to identify network loops. Numerous broadcast or multicast packets are seen on the network, When network loops happen. Protocols like ARP, DHCP etc. use broadcast or multicast extensively. We can check the ratio of these packet to make sure if further investigation is required for finding a network loop. Following figure shows a loop is existed in the network.

To open “Protocol Hierarchy Statistics”, navigate to “Statistics à Protocol Hierarchy”.
“eth.ig == 1” or “(eth.dst.lg == 1 ) or (eth.addr == ff:ff:ff:ff:ff:ff)” display filter can be used to find the ratio of broadcasts and multicasts like below.

Analyzing TCP Flags
TCP uses flags to indicate a particular state of the connection. By default, Wireshark’s TCP dissector tracks the state of each TCP session and provides additional information when problems or potential problems are detected. “(tcp.analysis.flags) && !(tcp.analysis.window_update)” filter displays all retransmissions, duplicate acks, zero windows, and more in the trace. It is very helpful when tracking down slow application performance and packet loss. The filtered packets will not include the window updates, since these are not the cause of the problem most of time.

Checking Size of Packets
Most of network devices have MTU of 1500 bytes in default, which refers the maximum packet size they will forward. When the client sends a packet larger than network path MTU, the packet either gets fragmented or dropped, depending on the “Don't Fragment (DF) bit”. Some application may send packets larger than path MTU, asking any network device on the path not to fragment them. In cases like that, the receiving network device drops the packet and notify the sender with a special ICMP packet. If there is a security device like a firewall in between sender and receiver, the ICMP packet gets dropped. Since the sender does not receive the ICMP notification packet, it does not adjust itself for the situation. Comparing the packet size of the sender and network path MTU can help to troubleshoot.
To see packets size in the conversation, navigate to “Statistics →Packet Lengths”.

Final Thoughts
Problems can stem from many different causes and it is not possible to cover every solution in the article. We explained common approaches and quick solutions for them in this how to use wireshark guide.
References
Wireshark website
Oreilly website
En website
Developer website