In my earlier article I had explained about Kubernetes Resources and how to assign resource quota in a namespace. Now let's make things more interesting and learn how to monitor resources of a Kubernetes Pod and Sidecar containers.
Normally in production environments, deployments are integrated with
different tools used for resource monitoring such as Prometheus or
Grafana but in this tutorial we will focus and plan to use traditional
tool i.e. kubectl to monitor Kubernetes pod and container resources
LIVE. These methods are not very friendly for production method so I
will keep the methods explained in this article for DEV environment for
dimensioning use cases such as you wish to figure out the resource
required for your application.
You can directly use Kubernetes Metrics API or using kubectl top command
which will give you LIVE feed of the current CPU and Memory usage of the
Pod. You can simply integrate the kubectl top command with while loop
to print and store the resource of the pods at regular intervals with
date and time stamp.
We will cover these topics in more detail through out this article.
Pre-requisite - Setup Metrics Server
The Kubernetes Metrics Server is a crucial
component for monitoring resource usage in a Kubernetes cluster. It
collects and aggregates resource usage data, such as CPU and memory
consumption, from the kubelets running on each node in the cluster. This
data is then exposed via the Metrics API, which can be queried using
kubectl top to provide real-time metrics about nodes and pods.
Before installing, ensure that the Metrics Server is not already installed:
kubectl get deployment metrics-server -n kube-systemIf the deployment exists, the Metrics Server is already installed.
If the Metrics Server is not installed, you can install it using the following command:
kubectl apply -f https://github.com/kubernetes-sigs/metrics-server/releases/latest/download/components.yamlSample Output:
serviceaccount/metrics-server created
clusterrole.rbac.authorization.k8s.io/system:aggregated-metrics-reader created
clusterrole.rbac.authorization.k8s.io/system:metrics-server created
rolebinding.rbac.authorization.k8s.io/metrics-server-auth-reader created
clusterrolebinding.rbac.authorization.k8s.io/metrics-server:system:auth-delegator created
clusterrolebinding.rbac.authorization.k8s.io/system:metrics-server created
service/metrics-server created
deployment.apps/metrics-server created
apiservice.apiregistration.k8s.io/v1beta1.metrics.k8s.io created
After installation, verify that the Metrics Server is running:
kubectl get deployment metrics-server -n kube-systemSample Output:
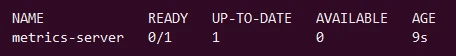
Ensure that the Metrics Server is functioning correctly by checking its logs:
kubectl logs -f deployment/metrics-server -n kube-systemIn my case I was getting below TLS error which indicates that the Metrics Server is having trouble verifying the TLS certificate of the Kubelet running on the node. This usually happens when the certificate presented by the Kubelet does not include the node's IP address in its Subject Alternative Names (SANs).
E0526 05:47:19.599506 1 scraper.go:149] "Failed to scrape node" err="Get \"https://172.19.200.6:10250/metrics/resource\": tls: failed to verify certificate: x509: cannot validate certificate for 172.19.200.6 because it doesn't contain any IP SANs" node="node01But since this was test deployment for me so I chose to skip TLS
validation by adding the --kubelet-insecure-tls flag:
kubectl edit deployment metrics-server -n kube-systemAdd the --kubelet-insecure-tls argument under the args section:
spec:
  containers:
  - args:
    - --cert-dir=/tmp
    - --secure-port=10250
    - --kubelet-preferred-address-types=InternalIP,ExternalIP,Hostname
    - --kubelet-use-node-status-port
    - --kubelet-insecure-tls
    ...
This argument tells the Metrics Server to skip the certificate verification when scraping the Kubelet metrics endpoint.
Save the changes and exit the editor. Kubernetes will automatically restart the Metrics Server with the updated configuration.
After updating the Metrics Server deployment, check the logs again to ensure that it is now able to scrape metrics without the certificate validation errors:
I0526 05:50:13.707602       1 shared_informer.go:311] Waiting for caches to sync for client-ca::kube-system::extension-apiserver-authentication::requestheader-client-ca-file
I0526 05:50:13.708527       1 secure_serving.go:213] Serving securely on [::]:10250
I0526 05:50:13.708698       1 dynamic_serving_content.go:132] "Starting controller" name="serving-cert::/tmp/apiserver.crt::/tmp/apiserver.key"
I0526 05:50:13.708883       1 tlsconfig.go:240] "Starting DynamicServingCertificateController"
I0526 05:50:13.807642       1 shared_informer.go:318] Caches are synced for client-ca::kube-system::extension-apiserver-authentication::client-ca-file
I0526 05:50:13.808149       1 shared_informer.go:318] Caches are synced for client-ca::kube-system::extension-apiserver-authentication::requestheader-client-ca-file
I0526 05:50:13.808560       1 shared_informer.go:318] Caches are synced for RequestHeaderAuthRequestController
Monitoring with kubectl top command
The kubectl top command allows you to view resource usage metrics for
nodes and pods in your Kubernetes cluster.
To view resource usage across all nodes in your cluster:
kubectl top nodesSample Output:
NAME           CPU(cores)   CPU%   MEMORY(bytes)   MEMORY%
controlplane   191m         9%     1328Mi          34%
node01 1026m 51% 746Mi 19%- CPU(cores): The total CPU usage on the node.
- CPU%: The percentage of CPU usage relative to the node's total capacity.
- MEMORY(bytes): The total memory usage on the node.
- MEMORY%: The percentage of memory usage relative to the node's total capacity.
To view resource usage across all pods in a specific namespace:
kubectl top pods -n <namespace>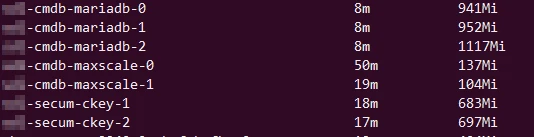
To view resource usage for specific containers within a pod use
--containers argument:
kubectl top pod <pod-name> -n <namespace> --containers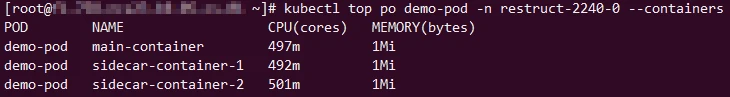
This provides a detailed view of resource usage for each container within the specified pod.
Monitoring using kubectl proxy and Metrics API
Open a terminal on your local machine (or any machine with kubectl
configured to access your Kubernetes cluster) and run:
kubectl proxyThis command starts a local proxy to the
Kubernetes API server and listens on localhost:8001.
In another terminal (while kubectl proxy is running), run the curl
command to access the Metrics API:
Confirm the service responds on localhost with curl; see the curl command for verbose mode, timeouts, and follow-redirect flags.
curl -s http://localhost:8001/apis/metrics.k8s.io/v1beta1/namespaces/<namespace>/pods/<pod-name> | jq '.containers[] | select(.name=="<container-name>") | {name: .name, usage: .usage}'For Example to check the resource of main-container inside demo
namespace part of demo-pod:
curl -s http://localhost:8001/apis/metrics.k8s.io/v1beta1/namespaces/demo/pods/demo-pod | jq '.containers[] | select(.name=="main-container") | {name: .name, usage: .usage}'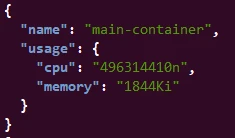
Similarly to check resource usage of sidecar-container-1:
curl -s http://localhost:8001/apis/metrics.k8s.io/v1beta1/namespaces/demo/pods/demo-pod | jq '.containers[] | select(.name=="sidecar-container-1") | {name: .name, usage: .usage}'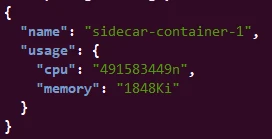
The Metrics API returns CPU usage in nanocores (n) and memory usage in kibibytes (Ki). You can convert these units to more familiar terms like millicores (m) for CPU and megabytes (MB) or gigabytes (GB) for memory.
# Assuming the following output from the previous step
cpu_nanocores=246694653
memory_kib=12236

# Convert CPU usage to millicores
cpu_millicores=$((cpu_nanocores / 1000000))

# Convert memory usage to MiB
memory_mib=$((memory_kib / 1024))

echo "CPU usage: ${cpu_millicores}m"
echo "Memory usage: ${memory_mib}Mi"
This script converts and prints the CPU usage in millicores and memory usage in MiB.
CPU usage: 246m
Memory usage: 11Mi
Script to monitor Kubernetes Resources at regular interval
Here is a simple shell script which can be used to monitor resources of all pods within a namespace at regular intervals and store the output in a log file:
#!/bin/bash

NAMESPACE="default"
OUTPUT_FILE="resource_usage.log"
SLEEP_INTERVAL=300  # Interval in seconds (300 seconds = 5 minutes)

# Create output file with headers if it doesn't exist
if [ ! -f $OUTPUT_FILE ]; then
    echo "timestamp,pod_name,container_name,cpu_usage,memory_usage" > $OUTPUT_FILE
fi

while true; do
    # Get current timestamp
    timestamp=$(date +%Y-%m-%dT%H:%M:%S%z)

    # Get resource usage for all pods in the specified namespace
    kubectl top pod -n $NAMESPACE --containers | awk -v timestamp="$timestamp" 'NR>1 {print timestamp "," $1 "," $2 "," $3 "," $4}' >> $OUTPUT_FILE

    # Sleep for the specified interval before the next iteration
    sleep $SLEEP_INTERVAL
done- NAMESPACE: The Kubernetes namespace from which to collect metrics.
- OUTPUT_FILE: The file where resource usage data will be logged.
- SLEEP_INTERVAL: The interval in seconds between data collection points (set to 300 seconds, or 5 minutes).
- Headers: The script initializes the log file with headers if it doesn't already exist.
- Infinite Loop: The
while trueloop ensures the script runs indefinitely, collecting data at regular intervals. - Timestamp: The current timestamp is collected at each interval.
- Data Collection:
kubectl top pod -n $NAMESPACE --containerscollects resource usage data for all containers within the pods in the specified namespace. - Data Logging: The data is formatted and appended to the log file.
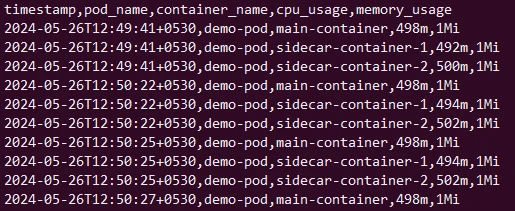
This will output in below format:
Alternatively we can also use Metrics API in a shell script to monitor resource usage at regular intervals:
#!/bin/bash

NAMESPACE="restruct-2240-0"
POD_NAME="demo-pod"
OUTPUT_FILE="specific_pod_metrics_usage.log"
SLEEP_INTERVAL=300  # Interval in seconds (300 seconds = 5 minutes)

# Start kubectl proxy in the background
kubectl proxy &
PROXY_PID=$!

# Ensure the proxy is terminated when the script exits
trap "kill $PROXY_PID" EXIT

# Add a brief delay to ensure kubectl proxy starts
sleep 5

# Create output file with headers if it doesn't exist
if [ ! -f $OUTPUT_FILE ]; then
    echo "timestamp,pod_name,container_name,cpu_usage(millicores),memory_usage(Mi)" > $OUTPUT_FILE
fi

while true; do
    # Get current timestamp
    timestamp=$(date +%Y-%m-%dT%H:%M:%S%z)

    # Fetch metrics from the Metrics API for the specific pod
    response=$(curl -s http://localhost:8001/apis/metrics.k8s.io/v1beta1/namespaces/$NAMESPACE/pods/$POD_NAME)

    # Check if the response is valid
    if [ -n "$response" ] && echo "$response" | jq -e . > /dev/null 2>&1; then
        # Parse the response and append to the output file
        echo "$response" | jq -r --arg timestamp "$timestamp" --arg pod_name "$POD_NAME" '
        .containers[] |
        .name as $container_name |
        (.usage.cpu // "0n" | sub("n"; "") | tonumber / 1000000 | tostring + "m") as $cpu_usage_millicores |
        (.usage.memory // "0Ki" | sub("Ki"; "") | tonumber / 1024 | tostring + "Mi") as $memory_usage_mi |
        "\($timestamp),\($pod_name),\($container_name),\($cpu_usage_millicores),\($memory_usage_mi)"
        ' >> $OUTPUT_FILE
    else
        echo "$timestamp,$POD_NAME,Error fetching metrics or invalid JSON response" >> $OUTPUT_FILE
    fi

    # Sleep for the specified interval before the next iteration
    sleep $SLEEP_INTERVAL
done
This jq command parses the JSON response to extract container names
and their CPU and memory usage:
.containers[]: Iterates over each container in the pod..name as $container_name: Extracts the container name.(.usage.cpu // "0n" | sub("n"; "") | tonumber / 1000000 | tostring + "m") as $cpu_usage_millicores: Converts CPU usage from nanocores to millicores and appends "m".(.usage.memory // "0Ki" | sub("Ki"; "") | tonumber / 1024 | tostring + "Mi") as $memory_usage_mi: Converts memory usage from kibibytes to mebibytes and appends "Mi".\($timestamp),\($pod_name),\($container_name),\($cpu_usage_millicores),\($memory_usage_mi): Formats the output string with the extracted values and appends it to the log file.
Sample Output:
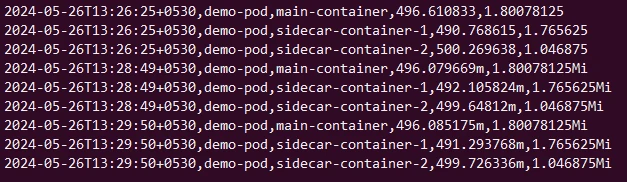
Well by the look of it we can assume that using Metrics API in a script can be tricky considering the fact that the resource information is not in user friendly format. The CPU usage is given in nanocores (n) while Memory usage is given in kibibytes (Ki) so we had to add additional logic to convert them to millicore (m) or cores for CPU and MB or GB for Memory.
Now it depends on your preference and requirement to use respective method to monitor resources of Kubernetes Pod and Sidecar Containers.
But as recommended earlier for production environment you should use tools such as Prometheus and Grafana for resource monitoring.