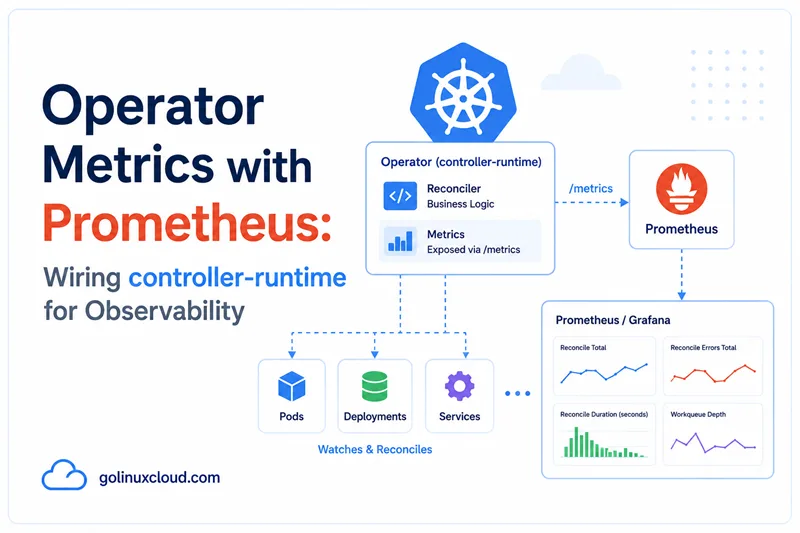
Metrics are the fastest way to tell whether a Kubernetes Operator is healthy in production. Logs explain individual events, but Prometheus metrics show whether the reconciler is falling behind, returning errors, hot-looping, timing out webhooks, or being throttled by the Kubernetes API server.
Most people searching for Kubernetes Operator metrics with Prometheus want a practical answer:
- Which metrics does
controller-runtimeexpose? - How do I expose
/metricsfrom my operator? - How do I create a Service and ServiceMonitor?
- How do I secure the endpoint?
- Which PromQL alerts should I start with?
- How do I add custom metrics without creating a cardinality problem?
This guide answers those questions as a step-by-step integration for Kubebuilder or Operator SDK projects using controller-runtime, prometheus-operator, and Grafana.
This is not a guide to the Kubernetes metrics.k8s.io Metrics API used by kubectl top, and it is not an HPA custom metrics tutorial. Here we are exposing the operator manager's /metrics endpoint and making Prometheus scrape it.
What you will build
By the end, your operator metrics path should look like this:
controller-runtime manager
  -> /metrics on 8080 or 8443
  -> Kubernetes Service
  -> ServiceMonitor
  -> Prometheus target
  -> PromQL alerts and Grafana panels
The article assumes Prometheus is usually already installed in the cluster. That is the common production case because platform teams normally provide kube-prometheus-stack, prometheus-operator, or an equivalent managed Prometheus setup.
If your cluster does not have Prometheus yet, install it first or use an existing Prometheus stack. For a lab, the shortest path is usually a Helm install of kube-prometheus-stack; for production, follow your platform team's monitoring standard.
Check whether your cluster already has the Prometheus Operator CRDs:
kubectl get crd servicemonitors.monitoring.coreos.com prometheusrules.monitoring.coreos.comSample output when the CRDs are installed:
NAME                                      CREATED AT
servicemonitors.monitoring.coreos.com    2026-06-15T10:03:36Z
prometheusrules.monitoring.coreos.com    2026-06-15T10:03:37Z
If the CRDs are missing, kubectl returns:
Error from server (NotFound): customresourcedefinitions.apiextensions.k8s.io "servicemonitors.monitoring.coreos.com" not found
Error from server (NotFound): customresourcedefinitions.apiextensions.k8s.io "prometheusrules.monitoring.coreos.com" not found
That means a ServiceMonitor manifest will not apply yet. Install Prometheus Operator first, or use a plain Prometheus scrape_configs job instead of ServiceMonitor.
Lab environment used for the examples
I tested the Kubernetes commands in a disposable kind cluster with a Kubebuilder-style sample operator already running.
kind get clustersSample output:
crd-conv
demo
go-operator
The active cluster for the test was kind-demo:
kubectl get nodesSample output:
NAME                 STATUS   ROLES           AGE   VERSION
demo-control-plane   Ready    control-plane   12d   v1.35.0
The sample operator was named demoapp-operator. Replace that with your operator name and namespace in the commands below.
kubectl get deploy,svc -n demoapp-operator-systemSample output:
NAME                                                  READY   UP-TO-DATE   AVAILABLE   AGE
deployment.apps/demoapp-operator-controller-manager   1/1     1            1           9d

NAME                                                          TYPE        CLUSTER-IP      EXTERNAL-IP   PORT(S)    AGE
service/demoapp-operator-controller-manager-metrics-service   ClusterIP   10.96.196.45    <none>        8443/TCP   9d
service/demoapp-operator-webhook-service                      ClusterIP   10.96.196.179   <none>        443/TCP    9d
This was enough to validate the metrics Service, EndpointSlice, secure endpoint behavior, RBAC check, ServiceMonitor, and PrometheusRule manifests. A full Prometheus server was not installed in this kind cluster, so the final Prometheus target page is shown as the expected production check rather than a local screenshot.
Step-by-step wiring checklist
Use this as the shortest path from operator code to working Prometheus targets:
| Step | What to check | Command or file |
|---|---|---|
| Manager exposes metrics | Metrics bind address and secure serving are configured | main.go manager options |
| Pod has metrics port | Container exposes 8080 or secure 8443 |
config/manager/manager.yaml |
| Service selects manager Pod | Service selector matches Deployment labels | kubectl get svc -n <ns> -o yaml |
| Service port is named | Port name matches ServiceMonitor endpoint | metrics or https-metrics |
| ServiceMonitor selects Service | spec.selector.matchLabels matches Service labels |
kubectl get servicemonitor -n <ns> -o yaml |
| Prometheus selects ServiceMonitor | ServiceMonitor labels match Prometheus selector | kubectl get prometheus -A -o yaml |
| Target is up | Prometheus target page shows operator endpoint | Prometheus UI or up{job=...} |
| RBAC allows scrape | Prometheus ServiceAccount can access secure metrics | ClusterRole and binding |
If the Prometheus target is missing, do not start with Go code. Start with selectors: Service selector, ServiceMonitor selector, and Prometheus serviceMonitorSelector.
Step 1: Check the default controller-runtime metrics
The exact set can vary by version and enabled features, but the high-value metrics fall into a few families.
Reconcile metrics
controller_runtime_reconcile_total{controller="database", result="success"}
controller_runtime_reconcile_total{controller="database", result="error"}
controller_runtime_reconcile_total{controller="database", result="requeue"}
controller_runtime_reconcile_total{controller="database", result="requeue_after"}
controller_runtime_reconcile_errors_total{controller="database"}
controller_runtime_reconcile_time_seconds_bucket{controller="database", le="..."}
Use these to answer:
- Is the reconciler running?
- Is it returning errors?
- Is reconcile latency rising?
- Is the controller requeueing more than normal?
Workqueue metrics
workqueue_depth{name="database"}
workqueue_queue_duration_seconds_bucket{name="database", le="..."}
workqueue_work_duration_seconds_bucket{name="database", le="..."}
workqueue_unfinished_work_seconds{name="database"}
workqueue_retries_total{name="database"}
Use these to answer:
- Is the operator falling behind?
- Are items sitting in the queue too long?
- Are resources stuck in retry loops?
REST client metrics
rest_client_requests_total{method="GET", code="200"}
rest_client_requests_total{method="PATCH", code="409"}
rest_client_requests_total{method="PATCH", code="429"}
rest_client_request_duration_seconds_bucket{verb="GET", le="..."}
Use these to answer:
- Is the operator overloading the Kubernetes API?
- Are requests being throttled?
- Are conflict retries normal or excessive?
- Are API calls becoming slow?
Leader election metrics
leader_election_master_status{name="database-operator"}For a highly available operator, the sum across replicas should normally be 1. A value of 0 means no active leader; a value greater than 1 suggests a dangerous leader election problem. See leader election explained.
Webhook metrics
If your operator runs admission webhooks, watch webhook request rate and latency:
controller_runtime_webhook_requests_total{webhook="/validate-v1-database"}
controller_runtime_webhook_latency_seconds_bucket{webhook="/validate-v1-database", le="..."}
Webhook metrics matter because a slow or broken webhook can block unrelated Kubernetes writes.
Step 2: Expose the metrics endpoint
Manager configuration
In controller-runtime, metrics are configured through manager options. A simplified example:
import (
    metricsserver "sigs.k8s.io/controller-runtime/pkg/metrics/server"
    ctrl "sigs.k8s.io/controller-runtime"
)

mgr, err := ctrl.NewManager(ctrl.GetConfigOrDie(), ctrl.Options{
    Scheme: scheme,
    Metrics: metricsserver.Options{
        BindAddress: ":8080",
        SecureServing: false,
    },
    HealthProbeBindAddress: ":8081",
})
For production, prefer secure metrics if your scaffold supports it:
Metrics: metricsserver.Options{
    BindAddress:   ":8443",
    SecureServing: true,
}
Kubebuilder and Operator SDK scaffolds change over time, so check your generated main.go and config/default patches. Some projects expose plain HTTP internally; others use secure metrics with authentication and TLS.
In a running cluster, confirm the manager process is actually using the metrics address you expect:
kubectl get deploy demoapp-operator-controller-manager \
  -n demoapp-operator-system \
  -o jsonpath='{.spec.template.spec.containers[0].args}'
Sample output from the kind test cluster:
["--metrics-bind-address=:8443","--leader-elect","--health-probe-bind-address=:8081","--webhook-cert-path=/tmp/k8s-webhook-server/serving-certs"]That output means this operator uses secure metrics on 8443, not plain HTTP on 8080.
Service for metrics
Prometheus usually discovers Services. Expose the manager metrics port with a Service:
apiVersion: v1
kind: Service
metadata:
  name: database-operator-metrics
  namespace: database-operator-system
  labels:
    app.kubernetes.io/name: database-operator
spec:
  selector:
    control-plane: controller-manager
  ports:
    - name: metrics
      port: 8080
      targetPort: 8080
For secure metrics, the Service may expose 8443 with a port name such as https-metrics:
ports:
  - name: https-metrics
    port: 8443
    targetPort: 8443
The ServiceMonitor must reference this port name exactly.
Verify the Service exists:
kubectl get svc demoapp-operator-controller-manager-metrics-service \
  -n demoapp-operator-system
Sample output:
NAME                                                  TYPE        CLUSTER-IP     EXTERNAL-IP   PORT(S)    AGE
demoapp-operator-controller-manager-metrics-service   ClusterIP   10.96.196.45   <none>        8443/TCP   9d
Then verify the Service has a live endpoint. On Kubernetes 1.33+, prefer EndpointSlice over the older Endpoints API:
kubectl get endpointslices -n demoapp-operator-system \
  -l kubernetes.io/service-name=demoapp-operator-controller-manager-metrics-service
Sample output:
NAME                                                        ADDRESSTYPE   PORTS   ENDPOINTS    AGE
demoapp-operator-controller-manager-metrics-service-zm5mh   IPv4          8443    10.244.0.2   9d
If the endpoint list is empty, Prometheus will not be able to scrape the operator. Fix the Service selector before changing any Prometheus configuration.
Step 3: Scrape with ServiceMonitor
In clusters using prometheus-operator, the cleanest production path is a ServiceMonitor.
apiVersion: monitoring.coreos.com/v1
kind: ServiceMonitor
metadata:
  name: database-operator
  namespace: database-operator-system
  labels:
    release: prometheus
spec:
  selector:
    matchLabels:
      app.kubernetes.io/name: database-operator
  namespaceSelector:
    matchNames:
      - database-operator-system
  endpoints:
    - port: metrics
      interval: 30s
      path: /metrics
For secure metrics:
endpoints:
  - port: https-metrics
    scheme: https
    path: /metrics
    interval: 30s
    bearerTokenFile: /var/run/secrets/kubernetes.io/serviceaccount/token
    tlsConfig:
      insecureSkipVerify: true
Use a real CA bundle instead of insecureSkipVerify: true when you can. It is shown here because many internal operator scaffolds use generated serving certificates during early setup.
Apply the ServiceMonitor:
kubectl apply -f operator-metrics-servicemonitor.yamlSample output from the kind validation after the ServiceMonitor CRD was installed:
servicemonitor.monitoring.coreos.com/demoapp-operator createdConfirm Kubernetes accepted it:
kubectl get servicemonitor demoapp-operator -n demoapp-operator-systemSample output:
NAME               AGE
demoapp-operator   15s
Three common ServiceMonitor mistakes:
- The ServiceMonitor selector does not match the Service labels.
- The endpoint
portdoes not match the Service port name. - The ServiceMonitor itself is not selected by the Prometheus
serviceMonitorSelector.
If a Prometheus instance is installed, check whether it selects this ServiceMonitor:
kubectl get prometheus -A -o yaml | grep -A6 serviceMonitorSelectorThen query Prometheus:
up{namespace="demoapp-operator-system"}A value of 1 means the target is being scraped. A missing series means discovery failed; a value of 0 means Prometheus discovered the target but cannot scrape it successfully.
Step 4: Secure the metrics endpoint
Production metrics can expose object names, API paths, error patterns, and runtime details. Treat the endpoint as operational data, not a public endpoint.
Common secure patterns:
| Pattern | How it works | Best fit |
|---|---|---|
| Secure controller-runtime metrics | Manager serves HTTPS metrics directly | Newer scaffolds and simple installs |
| kube-rbac-proxy style sidecar | Sidecar authenticates requests and proxies to local metrics | Clusters already using this pattern |
| NetworkPolicy only | Plain metrics limited to Prometheus namespace | Internal clusters with strict network boundaries |
RBAC example for scraping secure metrics:
apiVersion: rbac.authorization.k8s.io/v1
kind: ClusterRole
metadata:
  name: database-operator-metrics-reader
rules:
  - nonResourceURLs:
      - /metrics
    verbs:
      - get
Bind that role to the Prometheus ServiceAccount that performs the scrape. If your scaffold generated a metrics-reader role, reuse it rather than inventing another one.
Example binding for a Prometheus ServiceAccount named prometheus-k8s in the monitoring namespace:
apiVersion: rbac.authorization.k8s.io/v1
kind: ClusterRoleBinding
metadata:
  name: database-operator-metrics-reader
roleRef:
  apiGroup: rbac.authorization.k8s.io
  kind: ClusterRole
  name: database-operator-metrics-reader
subjects:
  - kind: ServiceAccount
    name: prometheus-k8s
    namespace: monitoring
Before the binding, the kind test returned no:
kubectl auth can-i get /metrics --as=system:serviceaccount:monitoring:prometheus-k8snoAfter applying the binding, the same check returned yes:
yesFor a secure metrics endpoint, an unauthenticated request should fail. This is good:
Confirm the service responds on localhost with curl; see the curl command for verbose mode, timeouts, and follow-redirect flags.
kubectl port-forward -n demoapp-operator-system svc/demoapp-operator-controller-manager-metrics-service 18443:8443

curl -k -i https://127.0.0.1:18443/metrics
Sample response:
HTTP/1.1 401 Unauthorized
Content-Type: text/plain; charset=utf-8

Unauthorized
If this returns metrics without authentication in production, treat it as an exposure problem unless the endpoint is otherwise isolated by network policy and cluster boundaries.
Step 5: Add custom operator metrics
Framework metrics explain how the controller runtime behaves. Custom metrics explain what your operator is achieving.
Good custom metrics:
- number of managed resources by readiness state,
- failed resources by bounded reason,
- external API call latency,
- reconcile stage duration,
- backup, restore, upgrade, or rollout outcomes,
- rate of degraded CustomResources.
Bad custom metrics:
- labels with CR names,
- labels with UIDs,
- labels with pod names,
- labels with request IDs,
- one time series per managed object when object count is unbounded.
Example custom metrics:
package controllers

import (
    "time"

    "github.com/prometheus/client_golang/prometheus"
    crmetrics "sigs.k8s.io/controller-runtime/pkg/metrics"
)

var (
    databaseReady = prometheus.NewGaugeVec(
        prometheus.GaugeOpts{
            Name: "database_operator_ready_resources",
            Help: "Number of Database resources by namespace and readiness state.",
        },
        []string{"namespace", "ready"},
    )

    reconcileStageSeconds = prometheus.NewHistogramVec(
        prometheus.HistogramOpts{
            Name:    "database_operator_reconcile_stage_seconds",
            Help:    "Time spent in each reconcile stage.",
            Buckets: prometheus.ExponentialBuckets(0.01, 2, 10),
        },
        []string{"stage"},
    )
)

func init() {
    crmetrics.Registry.MustRegister(databaseReady, reconcileStageSeconds)
}

func observeStage(stage string, start time.Time) {
    reconcileStageSeconds.WithLabelValues(stage).Observe(time.Since(start).Seconds())
}
Use labels such as namespace, ready, reason, and stage only when the number of possible values is bounded and useful.
Step 6: Add Prometheus alerts
Start small. These five alerts cover most operator incidents without creating a wall of noise.
apiVersion: monitoring.coreos.com/v1
kind: PrometheusRule
metadata:
  name: database-operator-alerts
  namespace: database-operator-system
  labels:
    release: prometheus
spec:
  groups:
    - name: database-operator
      rules:
        - alert: OperatorDown
          expr: up{job="database-operator"} == 0
          for: 5m
          labels:
            severity: critical
          annotations:
            summary: Database operator metrics target is down
            description: Prometheus cannot scrape the database operator metrics endpoint.

        - alert: OperatorReconcileErrors
          expr: sum(rate(controller_runtime_reconcile_errors_total{controller="database"}[5m])) > 0.1
          for: 10m
          labels:
            severity: warning
          annotations:
            summary: Database operator reconcile errors are increasing
            description: Reconcile errors are occurring at {{ $value }} errors per second.

        - alert: OperatorReconcileSlow
          expr: |
            histogram_quantile(0.99,
              sum by (le) (
                rate(controller_runtime_reconcile_time_seconds_bucket{controller="database"}[5m])
              )
            ) > 30
          for: 10m
          labels:
            severity: warning
          annotations:
            summary: Database operator p99 reconcile latency is high
            description: p99 reconcile latency is {{ $value }} seconds.

        - alert: OperatorWorkqueueBacklog
          expr: sum(workqueue_depth{name="database"}) > 100
          for: 15m
          labels:
            severity: warning
          annotations:
            summary: Database operator workqueue backlog is sustained
            description: Workqueue depth is {{ $value }} for more than 15 minutes.

        - alert: OperatorAPIThrottling
          expr: sum(rate(rest_client_requests_total{code="429"}[5m])) > 0.5
          for: 10m
          labels:
            severity: warning
          annotations:
            summary: Kubernetes API is throttling the operator
            description: Operator API requests are receiving HTTP 429 responses.
Apply the rule after the PrometheusRule CRD exists:
kubectl apply -f operator-prometheus-rules.yamlSample output from the kind validation:
prometheusrule.monitoring.coreos.com/demoapp-operator-alerts createdConfirm it exists:
kubectl get prometheusrule demoapp-operator-alerts -n demoapp-operator-systemSample output:
NAME                      AGE
demoapp-operator-alerts   15s
Tune thresholds after you have baseline data. A busy cluster may need higher workqueue thresholds, while a small operator may page on much lower values.
Step 7: Build a starter Grafana dashboard
Build one operational dashboard first. It should fit on one screen.
| Panel | Query idea | Question answered |
|---|---|---|
| Target health | up{job="database-operator"} |
Is Prometheus scraping the operator? |
| Reconcile rate | sum by (result) (rate(controller_runtime_reconcile_total{controller="database"}[5m])) |
What is the controller doing? |
| Reconcile errors | sum(rate(controller_runtime_reconcile_errors_total{controller="database"}[5m])) |
Is it failing? |
| Reconcile latency | histogram_quantile(0.99, sum by (le) (rate(controller_runtime_reconcile_time_seconds_bucket{controller="database"}[5m]))) |
Is reconcile slow? |
| Workqueue depth | sum(workqueue_depth{name="database"}) |
Is it falling behind? |
| API responses | sum by (code) (rate(rest_client_requests_total[5m])) |
Is the API server throttling or rejecting requests? |
| Leader status | sum(leader_election_master_status) |
Is there exactly one leader? |
| Business status | custom ready/failed gauges | Are managed resources healthy? |
Keep diagnostic panels in a second dashboard. The first dashboard should answer "is the operator healthy?" in less than a minute.
Troubleshooting missing metrics
| Symptom | Likely cause | Fix |
|---|---|---|
| ServiceMonitor exists but no Prometheus target | Prometheus does not select the ServiceMonitor | Match the ServiceMonitor labels to serviceMonitorSelector |
| Target exists but is down | Service endpoint, port name, TLS, or RBAC issue | Check Service endpoints, port name, scheme, token, and CA |
/metrics works with port-forward but Prometheus cannot scrape |
Service or ServiceMonitor selector mismatch | Compare Deployment labels, Service selector, and ServiceMonitor selector |
| Metrics endpoint returns 403 | Prometheus ServiceAccount lacks metrics RBAC | Bind the generated metrics-reader role or equivalent |
| Metrics endpoint returns TLS error | ServiceMonitor TLS config does not trust serving cert | Configure CA bundle or use scaffolded secure metrics settings |
| Workqueue alert fires after every restart | Threshold lacks a sustained window | Add for: 10m or longer |
| Prometheus memory jumps after new metric | High-cardinality labels | Remove CR name, UID, pod, request ID, or unbounded label |
| High reconcile rate with no errors | Reconcile hot loop | Check predicates, status updates, and unconditional requeues |
| 429 responses are sustained | API throttling | Reduce redundant API calls, tune concurrency/QPS, and review API Priority and Fairness |
Detect reconcile hot loops
A hot loop is a reconciler that keeps firing without useful state change. It often produces success results, so logs and error alerts may look clean.
Prometheus symptoms:
rate(controller_runtime_reconcile_total[5m])is far above normal.workqueue_depthorworkqueue_unfinished_work_secondsstays elevated.rest_client_requests_total{code="429"}starts rising.- Custom resource count is stable, but reconcile volume is not.
Common causes:
- missing
GenerationChangedPredicate, - updating
.statuson every reconcile even when nothing changed, - returning
requeue: truewithout a backoff or state transition, - watching owned resources that are updated by the controller itself,
- broad watches that enqueue too many unrelated objects.
Fixes usually live in controller wiring and status handling. See watches, events, and predicates and status subresource and conditions.
Cardinality rules for operators
Prometheus cardinality is the easiest way to make an otherwise useful metrics setup expensive and unreliable.
| Avoid label | Why |
|---|---|
| CR name | One time series per object |
| UID | Unbounded and changes over time |
| Pod name | Changes on rollout and restart |
| Request ID | Almost always unique |
| External object ID | Usually unbounded |
| Error message | Unbounded and noisy |
Prefer bounded labels:
controllernamespacewhen tenant count is boundedkindresultreasonstageoperation
For per-object information, use Kubernetes Events, logs, traces, or status conditions instead of Prometheus labels.
Checklist: production operator metrics
| Area | Recommended setup |
|---|---|
| Metrics endpoint | Exposed by manager on a known port |
| Service | Selects manager Pod and names the metrics port |
| ServiceMonitor | Selects the Service and is selected by Prometheus |
| Security | HTTPS and authentication in production |
| RBAC | Prometheus can read the metrics endpoint only as needed |
| Alerts | Down, errors, latency, backlog, throttling |
| Dashboard | One operational page plus optional diagnostic pages |
| Custom metrics | Business outcomes and bounded-stage timings |
| Cardinality | No CR names, UIDs, pod names, or request IDs as labels |
| Runbook | Missing target, 403, TLS, backlog, hot loop, and 429 steps documented |
Frequently Asked Questions
1. What metrics does controller-runtime expose by default?
2. How do I scrape Kubernetes Operator metrics with Prometheus?
3. What port does controller-runtime use for metrics?
4. Should operator metrics be secured?
5. Which Prometheus alerts should every operator have?
6. How do I add custom metrics to a Kubernetes Operator?
7. How do I avoid Prometheus cardinality explosions?
8. How can metrics detect a reconcile hot loop?
See also
Upstream references
- Kubebuilder metrics reference
- prometheus-operator ServiceMonitor API
- Prometheus client_golang
- Prometheus alerting rules
- kube-state-metrics
Bottom line: a production operator needs more than logs. Expose controller-runtime metrics, scrape them with a correctly selected ServiceMonitor, secure the endpoint, alert on the five core failure signals, and add only bounded custom metrics that explain whether your operator is doing useful work.