Steps that install or update RPM packages assume dnf command on RHEL-family systems.
traceroute — quick reference
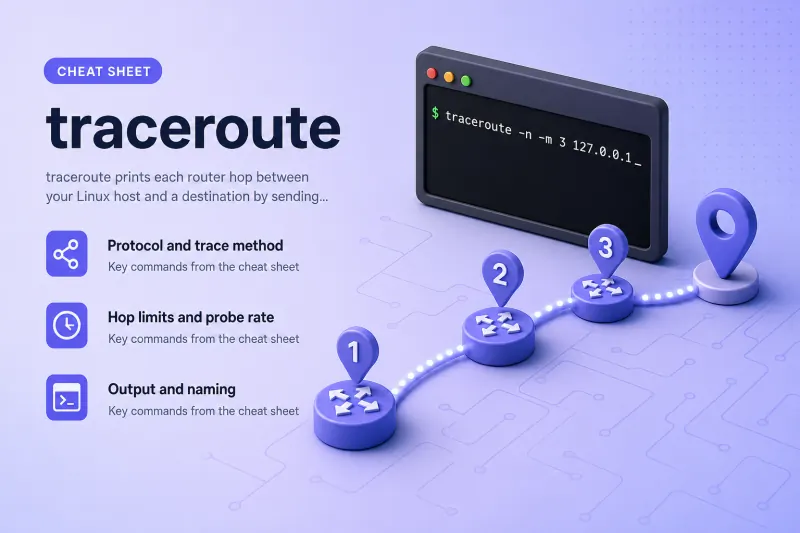
Protocol and trace method
Pick how probes reach the destination. Default is UDP with incrementing ports; ICMP and TCP often pass firewalls that block UDP.
| When to use | Command |
|---|---|
| Force IPv4 | traceroute -4 HOST |
| Force IPv6 | traceroute -6 HOST |
| Default UDP trace (ports start at 33434) | traceroute HOST |
| ICMP echo probes (like ping) | traceroute -I HOST |
| TCP SYN probes (default port 80) | traceroute -T HOST |
| UDP to a fixed destination port (default 53) | traceroute -U HOST |
| UDPLITE probes (default port 53) | traceroute -UL HOST |
| DCCP probes (default port 33434) | traceroute -D HOST |
| Raw protocol probes (default proto 253) | traceroute -P 253 HOST |
| Select trace module explicitly | traceroute -M icmp HOST |
| Pass module-specific options | traceroute -M tcp -O syn,info HOST |
| List options for a module | traceroute -M tcp -O help |
Hop limits and probe rate
| When to use | Command |
|---|---|
| Limit maximum hops (default 30) | traceroute -m 10 HOST |
| Start at a higher initial TTL | traceroute -f 5 HOST |
| Send fewer probes per hop (default 3) | traceroute -q 1 HOST |
| Run simultaneous probes (default 16) | traceroute -N 8 HOST |
| Pause between probes (seconds or ms if value > 10) | traceroute -z 0.5 HOST |
Output and naming
| When to use | Command |
|---|---|
| Show IP addresses only (skip DNS reverse lookups) | traceroute -n HOST |
| Show ICMP extensions (MPLS, interface info) | traceroute -e HOST |
| Append AS path registry lookups | traceroute -A HOST |
| Compare forward vs backward hop count estimate | traceroute --back HOST |
Timing
| When to use | Command |
|---|---|
Set wait timeouts (max[,here,near] seconds) |
traceroute -w 2 HOST |
| Adaptive wait with explicit ceiling only | traceroute -w 5,0,0 HOST |
Interface, source, and routing
| When to use | Command |
|---|---|
| Bind to a specific outbound interface | traceroute -i eth0 HOST |
| Set source IP address | traceroute -s 192.0.2.10 HOST |
Set source port (implies -N 1) |
traceroute --sport=40000 HOST |
| Set firewall mark on outgoing packets | traceroute --fwmark=1 HOST |
| Add an IP source-route gateway (often blocked today) | traceroute -g 192.0.2.1 HOST |
| Bypass routing table (directly attached host) | traceroute -r HOST |
Packet size and flags
| When to use | Command |
|---|---|
Set destination UDP port base (ICMP seq for -I) |
traceroute -p 33434 HOST |
| Set IPv4 TOS or IPv6 traffic class | traceroute -t 16 HOST |
| Set IPv6 flow label | traceroute -l 12345 HOST |
| Do not fragment probes (sets DF on IPv4) | traceroute -F HOST |
| Set total probe packet length | traceroute HOST 128 |
| Discover path MTU along the route | traceroute --mtu HOST |
Debugging and version
| When to use | Command |
|---|---|
| Enable socket-level debug output | traceroute -d HOST |
| Print version and exit | traceroute -V |
| Print help and exit | traceroute --help |
IPv6 via traceroute6 symlink |
traceroute6 -n HOST |
traceroute — command syntax
Synopsis from traceroute --help on Ubuntu 25.04 (traceroute 2.1.6):
traceroute [ -46dFITnreAUDV ] [ -f first_ttl ] [ -g gate,... ] [ -i device ]
           [ -m max_ttl ] [ -N squeries ] [ -p port ] [ -t tos ] [ -l flow_label ]
           [ -w MAX,HERE,NEAR ] [ -q nqueries ] [ -s src_addr ] [ -z sendwait ]
           [ --fwmark=num ] host [ packetlen ]
host is a hostname or IP address. Optional packetlen sets the probe size (default 60 bytes IPv4 / 80 IPv6). traceroute6 is equivalent to traceroute -6.
traceroute — command examples
Essential Quick trace to localhost with numeric output
Use loopback for safe lab tests — one hop, no external firewall noise. -n skips DNS lookups; -m 3 caps hops.
Run the command:
traceroute -n -m 3 127.0.0.1Sample output:
traceroute to 127.0.0.1 (127.0.0.1), 3 hops max, 60 byte packets
 1  127.0.0.1  0.102 ms  0.007 ms  0.004 ms
Three timings appear because traceroute sends three probes per hop by default. Asterisks on real networks usually mean filtered ICMP or no reply within the timeout.
Essential Install traceroute on Ubuntu if the command is missing
On Ubuntu 25.04 the package name is traceroute (Modern traceroute / traceroute.db).
sudo apt install tracerouteConfirm version:
traceroute -VSample output:
Modern traceroute for Linux, version 2.1.6
Copyright (c) 2016  Dmitry Butskoy,   License: GPL v2 or any later
Common Compare ICMP and TCP trace methods
Firewalls often block UDP high ports but allow ICMP or TCP to port 80.
ICMP echo (-I):
traceroute -I -n -m 3 127.0.0.1Sample output:
traceroute to 127.0.0.1 (127.0.0.1), 3 hops max, 60 byte packets
 1  127.0.0.1  0.129 ms  0.013 ms  0.003 ms
TCP SYN (-T, port 80 default):
traceroute -T -n -m 3 127.0.0.1Sample output:
traceroute to 127.0.0.1 (127.0.0.1), 3 hops max, 60 byte packets
 1  127.0.0.1  0.017 ms  0.004 ms  0.003 ms
On a remote host behind a firewall, try -I or -T -p 443 when default UDP traces stop early.
Common Force IPv4 or IPv6 tracing
When a hostname resolves to both families, traceroute prefers IPv4 unless you force -6.
IPv4:
traceroute -4 -n -m 3 127.0.0.1IPv6 loopback:
traceroute -6 -n -m 3 ::1Sample IPv6 output:
traceroute to ::1 (::1), 3 hops max, 80 byte packets
 1  ::1  0.065 ms  0.008 ms  0.007 ms
The traceroute6 command is the same as traceroute -6.
Common Limit hops, probes, and wait time
Short traces save time on LAN diagnostics; tuning probes reduces packet storms on sensitive routers.
Fewer hops and one probe per hop:
traceroute -q 1 -m 3 -n 127.0.0.1Sample output:
traceroute to 127.0.0.1 (127.0.0.1), 3 hops max, 60 byte packets
 1  127.0.0.1  0.017 ms
Tighter wait ceiling (2 seconds max):
traceroute -w 2 -n -m 3 127.0.0.1Slow routers on production paths: lower -N (simultaneous probes) or add -z 0.5 between sends.
Common UDP trace with a fixed destination port
-U sends UDP to one port (default 53) instead of incrementing from 33434 — useful when a firewall allows DNS-shaped UDP.
traceroute -U -n -m 3 127.0.0.1Sample output:
traceroute to 127.0.0.1 (127.0.0.1), 3 hops max, 60 byte packets
 1  127.0.0.1  0.099 ms  0.067 ms  0.057 ms
Combine with -p to pick another constant destination port.
Advanced Estimate path MTU with --mtu
--mtu probes with do-not-fragment set and reports when a hop requires a smaller MTU (F=NUM in output on real paths).
traceroute --mtu -n -m 3 127.0.0.1Sample output on loopback:
traceroute to 127.0.0.1 (127.0.0.1), 3 hops max, 65000 byte packets
 1  127.0.0.1  0.059 ms  0.298 ms  0.027 ms
On WAN links, watch for F= annotations when a router returns fragmentation-needed messages.
Advanced Inspect TCP module options before a firewall trace
Modern traceroute selects a module (default, icmp, tcp, …). List module flags before a tricky path.
traceroute -M tcp -O helpSample output (trimmed):
syn                         Set tcp flag SYN (default if no other tcp flags
                              specified)
  ack                         Set tcp flag ACK,
  fin                         FIN,
  flags=NUM                   Set tcp flags exactly to value NUM
  ecn                         Send syn packet with tcp flags ECE and CWR
  info                        Print tcp flags of final replies when target is reached
Example trace with module options:
traceroute -M tcp -O syn,info -T -n -m 3 127.0.0.1traceroute — when to use / when not
Choose traceroute when you need per-hop latency along a forward path. Pick another tool when you want continuous monitoring or a firewall-free default. When you need packet evidence on the wire, capture locally with the tcpdump command.
| Use traceroute when | Use something else when |
|---|---|
|
|
traceroute vs tracepath and mtr
| traceroute | tracepath | mtr | |
|---|---|---|---|
| Ships on Ubuntu | apt install traceroute |
iputils-tracepath (often preinstalled) |
apt install mtr-tiny |
| Methods | UDP (default), ICMP, TCP, UDPLITE, DCCP, raw | UDP by default; no method switching | Combines ping and traceroute |
| Firewalls | May need -I or -T |
Designed for filtered paths | Same probe limits as traceroute family |
| Output style | One-shot hop list | One-shot; prints MTU hints | Live updating table |
| Best for | Method choice and support scripts | Quick unprivileged trace | Ongoing loss and latency watch |
tracepath and mtr complement traceroute — they do not replace method-specific flags like -T or -M tcp -O syn.
Related commands
Network reachability and interface context around route tracing.
| Command | One line |
|---|---|
| traceroute | Trace hops to a host (this page) |
| ip | Show addresses, routes, and link state |
| tracepath | Firewall-friendly path trace (iputils) |
| mtr | Continuous traceroute plus ping statistics |
Browse the full index in our Linux commands reference.
traceroute — interview corner
How does traceroute work?
traceroute sends probe packets toward a destination with a low TTL (time to live). Each router decrements TTL; when it hits zero the router returns an ICMP time exceeded message. traceroute increases TTL each round and records which router replied and how long it took.
By default Ubuntu's traceroute sends three probes per hop and prints three RTT values. The final hop usually returns port unreachable (UDP method) or a TCP RST (-T) instead of time exceeded.
A strong answer is:
"traceroute increments TTL hop by hop and listens for ICMP time-exceeded from each router until the destination responds. Three probes per hop give three latency numbers; the method can be UDP, ICMP, or TCP depending on flags."
What do asterisks mean in traceroute output?
An * means no response arrived for that probe within the timeout. Common causes:
- Firewall drops ICMP or high UDP ports
- Router rate-limits ICMP responses
- Asymmetric return path so replies never reach you
- The hop simply does not reply to that probe type
Try another method (-I, -T, -U), lower -N, increase -w, or add -z delay. A * on middle hops while later hops reply is normal on many networks.
A strong answer is:
"Asterisks are missing replies — often filtered ICMP or UDP. I retry with -I or -T, reduce parallel probes with -N 1, and widen timeouts with -w before concluding the path is down."
Why use traceroute -I or -T instead of default UDP?
Default UDP tracing increments destination ports from 33434. Many firewalls block those "unlikely" ports, so the trace stops at *.
ICMP (-I) uses echo requests — same family as ping. TCP (-T) sends SYN packets to a port (default 80) using a half-open technique so the destination application does not see a full connection.
Pick the method that matches allowed traffic on the path you are testing.
A strong answer is:
"UDP traceroute is often filtered. -I uses ICMP echo like ping; -T uses TCP SYN to port 80 or another allowed port. I switch methods when UDP shows stars at the first external hop."
What is the difference between traceroute and mtr?
traceroute prints a single snapshot of hops and RTTs, then exits. mtr (My Traceroute) keeps sending probes and updates loss and latency per hop in real time — better for flaky links.
Both rely on similar TTL/expired-ICMP mechanics. Use traceroute for a quick path sample with method flags; use mtr when you need ongoing statistics.
A strong answer is:
"traceroute is a one-shot path sample with configurable probe methods; mtr continuously combines ping and traceroute to show per-hop loss and latency over time."
When would you use tracepath instead of traceroute?
tracepath from iputils sends UDP probes and needs no extra package on many Ubuntu installs. It is simpler and often works unprivileged through firewalls that block classic traceroute UDP ports.
traceroute (Modern traceroute) offers more methods (-T, -I, -U, module options) and finer control (-q, -N, -M). Use tracepath for a fast default trace; use traceroute when you must pick ICMP/TCP or script specific flags.
A strong answer is:
"tracepath is the quick iputils default when I just need a path; traceroute when I need ICMP or TCP methods, module options, or support-style flag control."
Troubleshooting
| Symptom | Likely cause | Fix |
|---|---|---|
traceroute: command not found |
Package not installed | sudo apt install traceroute on Ubuntu |
All hops show * |
Firewall filters probes | Retry with -I, -T, or -U; try -N 1 and -w 5 |
| Trace stops at first hop | Local firewall or policy routing | Check iptables/nft, try -i interface or -s source |
socket: Socket type not supported on -D |
DCCP not enabled in kernel | Use -I, -T, or default UDP instead |
| Wildly different RTTs on one hop | Parallel probes (-N 16) hitting rate limits |
traceroute -N 1 -n HOST |
| DNS slow or wrong names | Reverse lookups | Add -n for numeric output |
Cannot handle "host" cmdline arg |
Missing host argument | Pass hostname or IP after options |
| IPv6 trace fails | No IPv6 route or -4 forced |
Use traceroute -6 or traceroute6; verify ip -6 route |